Capital One 2009 Annual Report Download - page 190
Download and view the complete annual report
Please find page 190 of the 2009 Capital One annual report below. You can navigate through the pages in the report by either clicking on the pages listed below, or by using the keyword search tool below to find specific information within the annual report.-
 1
1 -
2
-
3
-
4
-
5
-
6
-
7
-
8
-
9
-
10
-
11
-
12
-
13
-
14
-
15
-
16
-
17
-
18
-
19
-
20
-
21
-
22
-
23
-
24
-
25
-
26
-
27
-
28
-
29
-
30
-
31
-
32
-
33
-
34
-
35
-
36
-
37
-
38
-
39
-
40
-
41
-
42
-
43
-
44
-
45
-
46
-
47
-
48
-
49
-
50
-
51
-
52
-
53
-
54
-
55
-
56
-
57
-
58
-
59
-
60
-
61
-
62
-
63
-
64
-
65
-
66
-
67
-
68
-
69
-
70
-
71
-
72
-
73
-
74
-
75
-
76
-
77
-
78
-
79
-
80
-
81
-
82
-
83
-
84
-
85
-
86
-
87
-
88
-
89
-
90
-
91
-
92
-
93
-
94
-
95
-
96
-
97
-
98
-
99
-
100
-
101
-
102
-
103
-
104
-
105
-
106
-
107
-
108
-
109
-
110
-
111
-
112
-
113
-
114
-
115
-
116
-
117
-
118
-
119
-
120
-
121
-
122
-
123
-
124
-
125
-
126
-
127
-
128
-
129
-
130
-
131
-
132
-
133
-
134
-
135
-
136
-
137
-
138
-
139
-
140
-
141
-
142
-
143
-
144
-
145
-
146
-
147
-
148
-
149
-
150
-
151
-
152
-
153
-
154
-
155
-
156
-
157
-
158
-
159
-
160
-
161
-
162
-
163
-
164
-
165
-
166
-
167
-
168
-
169
-
170
-
171
-
172
-
173
-
174
-
175
-
176
-
177
-
178
-
179
-
 180
180 -
 181
181 -
 182
182 -
 183
183 -
 184
184 -
 185
185 -
 186
186 -
 187
187 -
 188
188 -
 189
189 -
 190
190 -
 191
191 -
 192
192 -
 193
193 -
 194
194 -
 195
195 -
 196
196 -
 197
197 -
 198
198 -
 199
199 -
 200
200 -
201
-
202
-
203
-
204
-
205
-
206
-
207
-
208
-
209
 |
 |

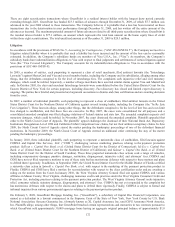
177
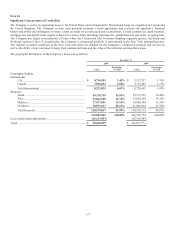
Note 24
Significant Concentration of Credit Risk
The Company is active in originating loans in the United States and internationally. International loans are originated in Canada and
the United Kingdom. The Company reviews each potential customer’s credit application and evaluates the applicant’s financial
history and ability and willingness to repay. Loans are made on an unsecured and secured basis. Certain commercial, small business,
mortgage and automobile loans require collateral in various forms including cash deposits, automobiles and real estate, as appropriate.
The Company has higher concentrations of loans where the Commercial and Consumer Banking segments operate, the South and
Northeast regions of the U.S. In particular, the Company’s commercial portfolio is concentrated in the New York metropolitan area.
The regional economic conditions in the New York area affect the demand for the Company’s commercial products and services as
well as the ability of our customers to repay their commercial loans and the value of the collateral securing these loans.
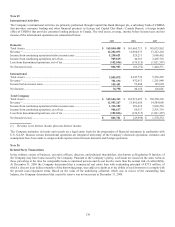
The geographic distribution of the Company’s loans was as follows:
December 31
2009 2008
Loans Percentage
of Total Loans
Percentage
of Total
Geographic Region:
International
U.K. ...................................................................................... $ 4,716,981 3.45% $ 5,527,237 3.76%
Canada ................................................................................. 3,506,854 2.56% 3,193,405 2.17%
Total International ................................................................ 8,223,835 6.01% 8,720,642 5.93%
Domestic
South .................................................................................... 49,170,769 35.94% 53,572,725 36.46%
West ..................................................................................... 22,842,140 16.70% 23,662,269 16.10%
Midwest ............................................................................... 17,973,051 13.14% 19,900,704 13.55%
Northeast .............................................................................. 38,593,107 28.21% 41,080,414 27.96%
Total Domestic ..................................................................... 128,579,067 93.99% 138,216,112 94.07%
136,802,902 100.00% 146,936,754 100.00%
Less securitization adjustments ..................................................... (46,183,903) (45,918,983)
Total............................................................................................... $ 90,618,999 $ 101,017,771