Capital One 2009 Annual Report Download - page 134
Download and view the complete annual report
Please find page 134 of the 2009 Capital One annual report below. You can navigate through the pages in the report by either clicking on the pages listed below, or by using the keyword search tool below to find specific information within the annual report.-
 1
1 -
2
-
3
-
4
-
5
-
6
-
7
-
8
-
9
-
10
-
11
-
12
-
13
-
14
-
15
-
16
-
17
-
18
-
19
-
20
-
21
-
22
-
23
-
24
-
25
-
26
-
27
-
28
-
29
-
30
-
31
-
32
-
33
-
34
-
35
-
36
-
37
-
38
-
39
-
40
-
41
-
42
-
43
-
44
-
45
-
46
-
47
-
48
-
49
-
50
-
51
-
52
-
53
-
54
-
55
-
56
-
57
-
58
-
59
-
60
-
61
-
62
-
63
-
64
-
65
-
66
-
67
-
68
-
69
-
70
-
71
-
72
-
73
-
74
-
75
-
76
-
77
-
78
-
79
-
80
-
81
-
82
-
83
-
84
-
85
-
86
-
87
-
88
-
89
-
90
-
91
-
92
-
93
-
94
-
95
-
96
-
97
-
98
-
99
-
100
-
101
-
102
-
103
-
104
-
105
-
106
-
107
-
108
-
109
-
110
-
111
-
112
-
113
-
114
-
115
-
116
-
117
-
118
-
119
-
120
-
121
-
122
-
123
-
 124
124 -
 125
125 -
 126
126 -
 127
127 -
 128
128 -
 129
129 -
 130
130 -
 131
131 -
 132
132 -
 133
133 -
 134
134 -
 135
135 -
 136
136 -
 137
137 -
 138
138 -
 139
139 -
 140
140 -
 141
141 -
 142
142 -
 143
143 -
 144
144 -
145
-
146
-
147
-
148
-
149
-
150
-
151
-
152
-
153
-
154
-
155
-
156
-
157
-
158
-
159
-
160
-
161
-
162
-
163
-
164
-
165
-
166
-
167
-
168
-
169
-
170
-
171
-
172
-
173
-
174
-
175
-
176
-
177
-
178
-
179
-
180
-
181
-
182
-
183
-
184
-
185
-
186
-
187
-
188
-
189
-
190
-
191
-
192
-
193
-
194
-
195
-
196
-
197
-
198
-
199
-
200
-
201
-
202
-
203
-
204
-
205
-
206
-
207
-
208
-
209
 |
 |

121
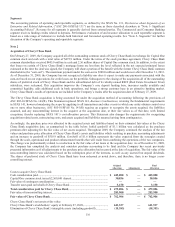
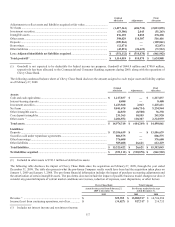
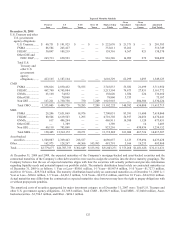
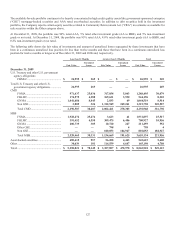
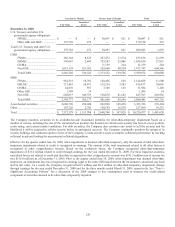
The following tables present certain information regarding our continuing operations by segment:
Year Ended December 31, 2009
Total Company
Credit
Card
Commercial
Banking
Consumer
Banking Other Total
Managed (1) Securitization
Adjustment(1)
Total
Reported
N
et interest income ........ $ 7,542,462 $ 1,144,388 $ 3,230,597 $ 172,048 $12,089,495 $(4,392,380) $ 7,697,115
N
on-interest income ....... 3,746,789 171,548 755,188 73,247 4,746,772 539,380 5,286,152
Provision for loan and
lease losses ................ 6,051,492 983,389 875,649 172,581 8,083,111 (3,853,000 ) 4,230,111
Restructuring
expenses .................... — — — 119,395 119,395 — 119,395
Other non-interest
expenses .................... 3,738,230 660,777 2,734,450 164,202 7,297,659 — 7,297,659
Income tax provision
(benefit) ..................... 521,909 (114,881 ) 131,490 (189,033 ) 349,485 — 349,485
N
et income (loss) from
continuing operations
net of tax ................... $ 977,620 $ (213,349 ) $ 244,196 $ (21,850 ) $ 986,617 $ — $ 986,617
Loans held for
investment ................. $68,523,662 $29,613,050 $38,214,493 $ 451,697 $136,802,902 $(46,183,903) $90,618,999
Total deposits ................. $ — $20,480,297 $74,144,805 $21,183,994 $115,809,096 $ — $115,809,096
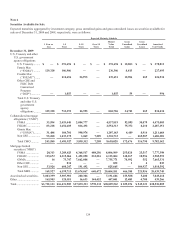
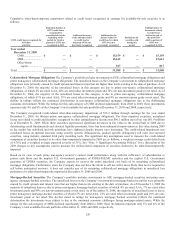
Year Ended December 31, 2008
Total Company
Credit
Card
Commercial
Banking
Consumer
Banking Other Total
Managed (1) Securitization
Adjustment(1)
Total
Reported
N
et interest income ........ $ 7,463,480 $ 961,372 $ 2,987,962 $ 9,241 $11,422,055 $(4,273,340) $ 7,148,715
N
on-interest income ....... 4,678,377 144,227 728,705 (133,911 ) 5,417,398 1,326,573 6,743,971
Provision for loan and
lease losses ................ 6,107,961 233,877 1,534,281 171,688 8,047,807 (2,946,767 ) 5,101,040
Restructuring
expenses .................... — — — 134,464 134,464 — 134,464
Goodwill impairment ..... — — 810,876 — 810,876 — 810,876
Other non-interest
expenses .................... 4,392,968 480,983 2,452,637 (61,901 ) 7,264,687 — 7,264,687
Income tax provision
(benefit) ..................... 573,908 136,759 (101,146 ) (112,419 ) 497,102 — 497,102
N
et income (loss) from
continuing operations
net of tax ................... $ 1,067,020 $ 253,980 $ (979,981 ) $ (256,502 ) $ 84,517 $ — $ 84,517
Loans held for
investment .............. $79,665,223 $ 29,541,314 $ 37,196,562 $ 533,655 $ 146,936,754 $(45,918,983) $101,017,771
Total deposits .............. $ — $ 16,483,361 $ 61,763,503 $ 30,373,925 $ 108,620,789 $ — $108,620,789