Capital One 2009 Annual Report Download - page 85
Download and view the complete annual report
Please find page 85 of the 2009 Capital One annual report below. You can navigate through the pages in the report by either clicking on the pages listed below, or by using the keyword search tool below to find specific information within the annual report.-
 1
1 -
2
-
3
-
4
-
5
-
6
-
7
-
8
-
9
-
10
-
11
-
12
-
13
-
14
-
15
-
16
-
17
-
18
-
19
-
20
-
21
-
22
-
23
-
24
-
25
-
26
-
27
-
28
-
29
-
30
-
31
-
32
-
33
-
34
-
35
-
36
-
37
-
38
-
39
-
40
-
41
-
42
-
43
-
44
-
45
-
46
-
47
-
48
-
49
-
50
-
51
-
52
-
53
-
54
-
55
-
56
-
57
-
58
-
59
-
60
-
61
-
62
-
63
-
64
-
65
-
66
-
67
-
68
-
69
-
70
-
71
-
72
-
73
-
74
-
 75
75 -
 76
76 -
 77
77 -
 78
78 -
 79
79 -
 80
80 -
 81
81 -
 82
82 -
 83
83 -
 84
84 -
 85
85 -
 86
86 -
 87
87 -
 88
88 -
 89
89 -
 90
90 -
 91
91 -
 92
92 -
 93
93 -
 94
94 -
 95
95 -
96
-
97
-
98
-
99
-
100
-
101
-
102
-
103
-
104
-
105
-
106
-
107
-
108
-
109
-
110
-
111
-
112
-
113
-
114
-
115
-
116
-
117
-
118
-
119
-
120
-
121
-
122
-
123
-
124
-
125
-
126
-
127
-
128
-
129
-
130
-
131
-
132
-
133
-
134
-
135
-
136
-
137
-
138
-
139
-
140
-
141
-
142
-
143
-
144
-
145
-
146
-
147
-
148
-
149
-
150
-
151
-
152
-
153
-
154
-
155
-
156
-
157
-
158
-
159
-
160
-
161
-
162
-
163
-
164
-
165
-
166
-
167
-
168
-
169
-
170
-
171
-
172
-
173
-
174
-
175
-
176
-
177
-
178
-
179
-
180
-
181
-
182
-
183
-
184
-
185
-
186
-
187
-
188
-
189
-
190
-
191
-
192
-
193
-
194
-
195
-
196
-
197
-
198
-
199
-
200
-
201
-
202
-
203
-
204
-
205
-
206
-
207
-
208
-
209
 |
 |

72
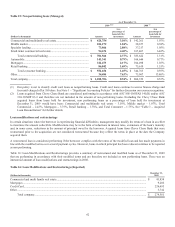
Net adjusted charge-offs increased by $1.7 billion or 50.0% from 2007 to 2008. The net adjusted charge off rate increased from 4.23%
to 6.26%. The allowance for loan losses experienced a build during the year of $1.2 billion versus a build of $328.5 million in 2007.
The higher build was a result of the worsening economic environment at the end of 2008. The increase of net adjusted charge offs and
increase in allowance resulted in a $6.1 billion net provision for loan losses in 2008 an increase of $2.5 billion or 68.0% over 2007. On
the Domestic Card side, the start of the recession caused net adjusted charge-offs to increase to $4.3 billion, which is higher by $1.7
billion or 62.9% from 2007 to 2008. The allowance for loan losses experienced a build during the year of $1.1 billion versus a build of
$362.5 million in 2007. The increase of net adjusted charge offs and increase in allowance resulted in a $5.5 billion net provision for
loan losses in 2008 an increase of $2.4 billion or 80.0% over 2007. International Card experienced a decrease in net adjusted charge
offs of $26.1 million to $610.2 million in 2008. The underlying change, with no foreign exchange rate movements, reveals that charge
offs would have increased by $10.0 million. The onset of the recession in the U.K. in late 2008 caused the increase in charge offs. In
2008, the allowance for loan losses experienced a build of $37.8 million versus a release of $34.0 million in 2007. In total, the net
provision for loan losses in International Card increased from $602.3 million in 2007 to $647.0 million in 2008.
Non-interest expense was $4.4 billion for 2008 which is a decline of $408.7 million or 8.5% from 2007. Domestic Card’s 2009 non-
interest expense declined by $311.7 million or 7.9% from 2007 to $3.6 billion driven by risk related pullbacks in marketing as
efficiency improvements in operations. International Card non-interest expense declined by $96.9 million or 11.2% to $770.1 million
from 2007 to 2008. About $24.0 million of the decline was a result of exchange rate movements. Expenses have gone down due to
pullbacks in marketing and operating efficiency gains.
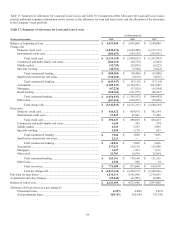
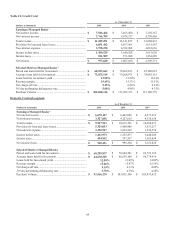
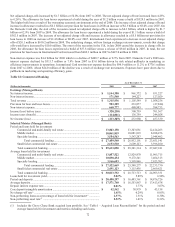
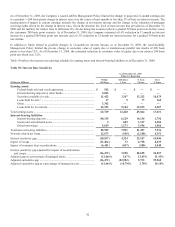
Table 22: Commercial Banking
As of December 31
(Dollars in thousands) 2009 2008
2007
Earnings (Managed Basis)
N
et interest income ............................................................................................ $ 1,144,388 $ 961,372 $ 931,227
N
on-interest income ........................................................................................... 171,548 144,227 127,029
Total revenue ..................................................................................................... $ 1,315,936 $ 1,105,599 $ 1,058,256
Provision for loan and lease losses .................................................................... 983,389 233,877 (27,844)
N
on-interest expense .......................................................................................... 660,777 480,983 384,733
Income (loss) before taxes ................................................................................. (328,230) 390,739 701,367
Income taxes (benefit) ........................................................................................ (114,881) 136,759 244,028
N
et income (loss) ............................................................................................... $ (213,349) $ 253,980 $ 457,339
Selected Metrics (Managed Basis)
Period end loans held for investment
Commercial and multi-family real estate ................................................. 13,843,158 13,303,081 12,414,263
Middle market .......................................................................................... 10,061,819 10,081,823 8,288,476
Specialty lending ...................................................................................... 3,554,563 3,547,287 2,948,402
Total commercial lending ............................................................... $ 27,459,540 $ 26,932,191 $ 23,651,141
Small ticket commercial real estate .......................................................... 2,153,510 2,609,123 3,396,100
Total commercial banking ........................................................................ $ 29,613,050 $ 29,541,314 $ 27,047,241
Average loans held for investment
Commercial and multi-family real estate ................................................. 13,857,522 12,829,870 11,905,715
Middle market .......................................................................................... 10,098,454 9,172,541 7,404,313
Specialty lending ...................................................................................... 3,566,693 3,595,866 2,923,702
Total commercial lending ............................................................... $ 27,522,669 $ 25,598,277 $ 22,233,730
Small ticket commercial real estate .......................................................... 2,491,123 3,115,436 2,669,621
Total commercial banking ........................................................................ $ 30,013,792 $ 28,713,713 $ 24,903,351
Loans held for investment yield ......................................................................... 5.02% 5.89% 6.98%
Period end deposits ............................................................................................ $ 20,480,297 $ 16,483,361 $ 14,876,726
Average deposits ................................................................................................ $ 17,571,740 $ 16,553,867 $ 17,413,678
Deposit interest expense rate.............................................................................. 0.81% 1.77% 3.07%
Core deposit intangible amortization ................................................................. $ 42,562 $ 38,979 $ 43,158
N
et charge-off rate(1) .......................................................................................... 1.45% 0.29% 0.05%
N
on-performing loans as a percentage of loans held for investment(1) .............. 2.37% 1.31% 0.30%
N
on-performing asset rate(1) .............................................................................. 2.52% 1.41% 0.32%
(1) Includes the Chevy Chase Bank acquired loan portfolio. See “Table I – Acquired Loan Reconciliation” for the period end and
average loans held for investment and metrics excluding such loans.