Capital One 2009 Annual Report Download - page 139
Download and view the complete annual report
Please find page 139 of the 2009 Capital One annual report below. You can navigate through the pages in the report by either clicking on the pages listed below, or by using the keyword search tool below to find specific information within the annual report.-
 1
1 -
2
-
3
-
4
-
5
-
6
-
7
-
8
-
9
-
10
-
11
-
12
-
13
-
14
-
15
-
16
-
17
-
18
-
19
-
20
-
21
-
22
-
23
-
24
-
25
-
26
-
27
-
28
-
29
-
30
-
31
-
32
-
33
-
34
-
35
-
36
-
37
-
38
-
39
-
40
-
41
-
42
-
43
-
44
-
45
-
46
-
47
-
48
-
49
-
50
-
51
-
52
-
53
-
54
-
55
-
56
-
57
-
58
-
59
-
60
-
61
-
62
-
63
-
64
-
65
-
66
-
67
-
68
-
69
-
70
-
71
-
72
-
73
-
74
-
75
-
76
-
77
-
78
-
79
-
80
-
81
-
82
-
83
-
84
-
85
-
86
-
87
-
88
-
89
-
90
-
91
-
92
-
93
-
94
-
95
-
96
-
97
-
98
-
99
-
100
-
101
-
102
-
103
-
104
-
105
-
106
-
107
-
108
-
109
-
110
-
111
-
112
-
113
-
114
-
115
-
116
-
117
-
118
-
119
-
120
-
121
-
122
-
123
-
124
-
125
-
126
-
127
-
128
-
 129
129 -
 130
130 -
 131
131 -
 132
132 -
 133
133 -
 134
134 -
 135
135 -
 136
136 -
 137
137 -
 138
138 -
 139
139 -
 140
140 -
 141
141 -
 142
142 -
 143
143 -
 144
144 -
 145
145 -
 146
146 -
 147
147 -
 148
148 -
 149
149 -
150
-
151
-
152
-
153
-
154
-
155
-
156
-
157
-
158
-
159
-
160
-
161
-
162
-
163
-
164
-
165
-
166
-
167
-
168
-
169
-
170
-
171
-
172
-
173
-
174
-
175
-
176
-
177
-
178
-
179
-
180
-
181
-
182
-
183
-
184
-
185
-
186
-
187
-
188
-
189
-
190
-
191
-
192
-
193
-
194
-
195
-
196
-
197
-
198
-
199
-
200
-
201
-
202
-
203
-
204
-
205
-
206
-
207
-
208
-
209
 |
 |

126
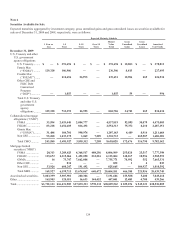
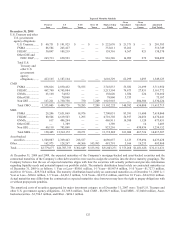
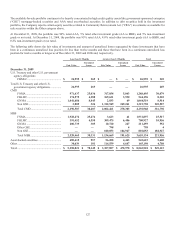
The following tables show the weighted average yield by investment category for expected maturities as of December 31, 2009 and
2008, respectively.
Weighted Average Yield Schedule
1 Year
or Less 1–5
Years 5–10
Years
Over 10
Years
December 31, 2009
U.S. Treasury and other U.S. government agency obligations
U.S. Treasury ........................................................................................ — % 2.37% — % — %
FNMA ................................................................................................... 4.34 4.51 — —
FHMLC ................................................................................................. — 4.63 3.29 —
Other GSE and FDIC DGP ................................................................... — 5.44 — —
Total U.S. Treasury and other U.S. government agency obligations .... 4.34 3.36 3.29 —
CMO
FNMA ................................................................................................... 4.99 5.13 4.73 —
FHLMC ................................................................................................. 5.16 5.25 5.35 —
GNMA .................................................................................................. 4.57 4.37 4.27 —
Non GSE ............................................................................................... 5.75 5.58 5.13 6.58
Total CMO ............................................................................................ 5.31 5.26 4.74 6.58
MBS
FNMA ................................................................................................... 5.34 4.98 4.95 5.12
FHMLC ................................................................................................. 5.55 4.32 5.26 5.23
GNMA .................................................................................................. 6.71 6.17 4.86 —
Other GSE ............................................................................................. — 3.44 — —
Non GSE ............................................................................................... 5.89 5.95 5.99 —
Total MBS ............................................................................................ 5.40 5.06 4.91 5.18
Asset-backed securities .................................................................................. 3.36 4.00 4.87 —
Other ............................................................................................................... 2.71 4.19 4.60 0.56
Total ............................................................................................................... 3.56% 4.74% 4.90% 5.04%
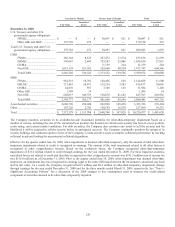
Weighted Average Yield Schedule
1 Year
or Less 1–5
Years 5–10
Years
Over 10
Years
December 31, 2008
U.S. Treasury and other U.S. government agency obligations .......................
U.S. Treasury ........................................................................................ 4.04% 4.15% — % — %
FNMA ................................................................................................... 4.68 4.41 — —
FHLMC ................................................................................................. 4.00 4.59 — —
Other GSE and FDIC DGP ................................................................... 4.81 3.13 — —
Total U.S. Treasury and other U.S. government agency obligations .... 4.65 3.67 — —
CMO
FNMA ................................................................................................... 4.98 5.53 5.50 —
FHLMC ................................................................................................. 5.23 5.22 — —
GNMA .................................................................................................. 4.61 4.89 — —
Other GSE ............................................................................................. — 5.27 — —
Non GSE ............................................................................................... 5.72 5.51 6.10 6.58
Total CMO ............................................................................................ 5.14 5.37 5.51 6.58
MBS
FNMA ................................................................................................... 4.05 5.31 5.48 —
FHLMC ................................................................................................. 6.00 4.79 5.89 —
GNMA .................................................................................................. 7.08 5.65 — —
Other GSE ............................................................................................. — 3.43 — —
Non GSE ............................................................................................... 6.30 5.96 — —
Total MBS ............................................................................................ 5.76 5.21 5.50 —
Asset-backed securities .................................................................................. 4.07 4.72 5.16 —
Other ............................................................................................................... 3.74 4.21 4.75 5.49
Total ............................................................................................................... 4.63% 5.15% 5.20% 5.53%