Capital One 2009 Annual Report Download - page 89
Download and view the complete annual report
Please find page 89 of the 2009 Capital One annual report below. You can navigate through the pages in the report by either clicking on the pages listed below, or by using the keyword search tool below to find specific information within the annual report.-
 1
1 -
2
-
3
-
4
-
5
-
6
-
7
-
8
-
9
-
10
-
11
-
12
-
13
-
14
-
15
-
16
-
17
-
18
-
19
-
20
-
21
-
22
-
23
-
24
-
25
-
26
-
27
-
28
-
29
-
30
-
31
-
32
-
33
-
34
-
35
-
36
-
37
-
38
-
39
-
40
-
41
-
42
-
43
-
44
-
45
-
46
-
47
-
48
-
49
-
50
-
51
-
52
-
53
-
54
-
55
-
56
-
57
-
58
-
59
-
60
-
61
-
62
-
63
-
64
-
65
-
66
-
67
-
68
-
69
-
70
-
71
-
72
-
73
-
74
-
75
-
76
-
77
-
78
-
 79
79 -
 80
80 -
 81
81 -
 82
82 -
 83
83 -
 84
84 -
 85
85 -
 86
86 -
 87
87 -
 88
88 -
 89
89 -
 90
90 -
 91
91 -
 92
92 -
 93
93 -
 94
94 -
 95
95 -
 96
96 -
 97
97 -
 98
98 -
 99
99 -
100
-
101
-
102
-
103
-
104
-
105
-
106
-
107
-
108
-
109
-
110
-
111
-
112
-
113
-
114
-
115
-
116
-
117
-
118
-
119
-
120
-
121
-
122
-
123
-
124
-
125
-
126
-
127
-
128
-
129
-
130
-
131
-
132
-
133
-
134
-
135
-
136
-
137
-
138
-
139
-
140
-
141
-
142
-
143
-
144
-
145
-
146
-
147
-
148
-
149
-
150
-
151
-
152
-
153
-
154
-
155
-
156
-
157
-
158
-
159
-
160
-
161
-
162
-
163
-
164
-
165
-
166
-
167
-
168
-
169
-
170
-
171
-
172
-
173
-
174
-
175
-
176
-
177
-
178
-
179
-
180
-
181
-
182
-
183
-
184
-
185
-
186
-
187
-
188
-
189
-
190
-
191
-
192
-
193
-
194
-
195
-
196
-
197
-
198
-
199
-
200
-
201
-
202
-
203
-
204
-
205
-
206
-
207
-
208
-
209
 |
 |
76
VIII. Liquidity and Funding
Liquidity risk is the risk that future financial obligations are not met or future asset growth cannot occur because of an inability to
obtain funds at a reasonable price within a reasonable time. Liquidity is assessed through balance sheet metrics, and stress testing is
used to ensure that the Company can withstand significant degradation in the funding markets (particularly in the wholesale funding
markets). Management regularly evaluates its liquidity position under various liquidity stress scenarios with the Asset/Liability
Management Committee and Finance Committee, providing recommendations for any necessary actions to ensure the Company’s
liquidity risk exposure is well managed. Management reports liquidity metrics to the Finance Committee no less than quarterly.
Breaches in liquidity policy limits are reported to the Treasurer as soon as they are identified and to the Asset/Liability Management
Committee at the next regularly scheduled committee meeting, unless the breach activates the Company’s Liquidity Contingency Plan.
Breaches are also reported to the Finance Committee no later than the next regularly scheduled meeting. Detailed processes,
requirements and controls are contained in the Company’s policies and supporting procedures.
The Company manages liquidity risk to ensure that we can fund asset and loan growth, debt and deposit maturities and withdrawals,
and payment of other corporate obligations. To achieve this, the Company’s Asset/Liability Management Committee and Finance
Committee establish liquidity guidelines to ensure that the Company can withstand significant degradation in the funding markets as
well as deposit attrition. The Company seeks to maintain a large liquidity reserve to guard against possible degradation. This reserve is
comprised of cash and cash equivalents, unencumbered securities available for sale and undrawn committed borrowing facilities. The
current economic environment could have an adverse impact on our asset values, including our securities available for sale, and
impact our ability to borrow funds or engage in securitization transactions.
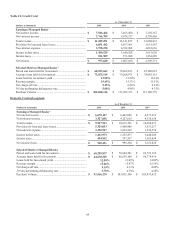
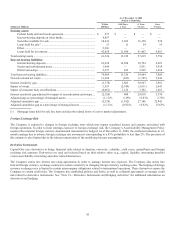
The Company uses a variety of funding sources to establish a maturity pattern that provides a prudent mixture of short-term and long-
term funds. The Company obtains funds through the gathering of deposits, issuing debt and equity securities, and securitizing assets.
Further liquidity is available to the Company through committed borrowing facilities, including undrawn conduits, FHLB advances
and various government programs.
Cash and cash equivalents Cash and cash equivalents provide immediate sources of funds to meet the Company’s liquidity needs,
including dividend payments and other funding and debt service obligations.
Securities Available for Sale Securities available for sale provide liquidity to the Company through cash flows from the portfolio and
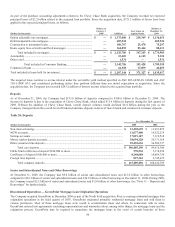
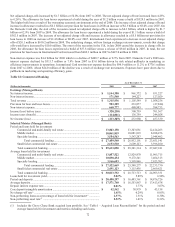
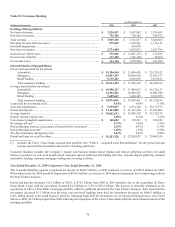
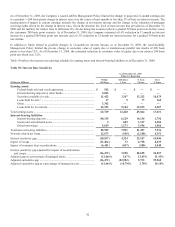
the ability to pledge or otherwise use the securities as collateral to support borrowing programs. At December 31, 2009, $11.9 billion
of the Company’s $38.8 billion available for sale securities were pledged, compared to $13.7 billion pledged at December 31, 2008.
As of December 31, 2009, the weighted average life of the investment securities was approximately 4.9 years compared to 2.6 years at
December 31, 2008.
The Company monitors the available for sale investment securities for other-than-temporary impairment based on a number of criteria,
including the size of the unrealized loss position, the duration for which the security has been in a loss position, credit rating, the
nature of the investments, current market conditions and the Company’s decision to sell and not more likely than not that it will be
required to sell the securities until anticipated recovery, which may be upon maturity. Credit related impairment is recognized in
earnings and impairment due to all other factors is recognized in other comprehensive income. The Company recognized other-than-
temporary impairment charges of $32.0 million for the year ended December 31, 2009 compared to $10.9 million for the year ended
December 31, 2008. The available for sale investment securities had net unrealized gains of $290.8 million as of December 2009
compared to a net unrealized loss of $1.1 billion loss as of December 31, 2008. See “Note 6 – Securities Available for Sale” for
further details.
Deposits Deposits have become the Company’s largest funding source. Deposits provide a stable, low-cost source of funds that we
utilize to fund loan and asset growth and to diversify funding sources. The Company has continued to expand its deposit gathering
efforts through its direct and indirect marketing channels, the existing branch network and through de novo branch expansion. These
channels offer a broad set of deposit products that include demand deposits, money market deposits, NOW accounts, and certificates
of deposit (“CDs”).
As of December 31, 2009, the Company had $115.8 billion in deposits of which $897.4 million were held in foreign banking offices
and $8.8 billion represented large domestic denomination certificates of $100 thousand or more. The Company’s core deposits are
comprised of domestic non-interest bearing deposits, NOW accounts, money market deposit accounts, savings accounts, CDs of less
than $100,000 and other consumer time deposits. The Company maintains a Grand Cayman branch for issuing Eurodollar time
deposits.
The Company has deposits that are obtained through the use of a third-party intermediary. Included in these deposits at December 31,
2009 were brokered deposits of $14.1 billion, compared to $26.9 billion at December 31, 2008. These deposits represented 12.2% and
24.8% of total deposits at December 31, 2009 and 2008, respectively. If these brokered deposits are not renewed at maturity, the
Company would use its investment securities and money market instruments in addition to alternative funding sources to fund
increases in loans and meet its other liquidity needs. The Federal Deposit Insurance Corporation Improvement Act of 1991 limits the