PNC Bank 2011 Annual Report Download - page 99
Download and view the complete annual report
Please find page 99 of the 2011 PNC Bank annual report below. You can navigate through the pages in the report by either clicking on the pages listed below, or by using the keyword search tool below to find specific information within the annual report.-
 1
1 -
2
-
3
-
4
-
5
-
6
-
7
-
8
-
9
-
10
-
11
-
12
-
13
-
14
-
15
-
16
-
17
-
18
-
19
-
20
-
21
-
22
-
23
-
24
-
25
-
26
-
27
-
28
-
29
-
30
-
31
-
32
-
33
-
34
-
35
-
36
-
37
-
38
-
39
-
40
-
41
-
42
-
43
-
44
-
45
-
46
-
47
-
48
-
49
-
50
-
51
-
52
-
53
-
54
-
55
-
56
-
57
-
58
-
59
-
60
-
61
-
62
-
63
-
64
-
65
-
66
-
67
-
68
-
69
-
70
-
71
-
72
-
73
-
74
-
75
-
76
-
77
-
78
-
79
-
80
-
81
-
82
-
83
-
84
-
85
-
86
-
87
-
88
-
 89
89 -
 90
90 -
 91
91 -
 92
92 -
 93
93 -
 94
94 -
 95
95 -
 96
96 -
 97
97 -
 98
98 -
 99
99 -
 100
100 -
 101
101 -
 102
102 -
 103
103 -
 104
104 -
 105
105 -
 106
106 -
 107
107 -
 108
108 -
 109
109 -
110
-
111
-
112
-
113
-
114
-
115
-
116
-
117
-
118
-
119
-
120
-
121
-
122
-
123
-
124
-
125
-
126
-
127
-
128
-
129
-
130
-
131
-
132
-
133
-
134
-
135
-
136
-
137
-
138
-
139
-
140
-
141
-
142
-
143
-
144
-
145
-
146
-
147
-
148
-
149
-
150
-
151
-
152
-
153
-
154
-
155
-
156
-
157
-
158
-
159
-
160
-
161
-
162
-
163
-
164
-
165
-
166
-
167
-
168
-
169
-
170
-
171
-
172
-
173
-
174
-
175
-
176
-
177
-
178
-
179
-
180
-
181
-
182
-
183
-
184
-
185
-
186
-
187
-
188
-
189
-
190
-
191
-
192
-
193
-
194
-
195
-
196
-
197
-
198
-
199
-
200
-
201
-
202
-
203
-
204
-
205
-
206
-
207
-
208
-
209
-
210
-
211
-
212
-
213
-
214
-
215
-
216
-
217
-
218
-
219
-
220
-
221
-
222
-
223
-
224
-
225
-
226
-
227
-
228
-
229
-
230
-
231
-
232
-
233
-
234
-
235
-
236
-
237
-
238
 |
 |

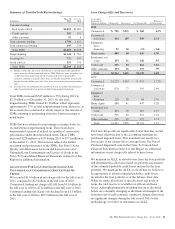
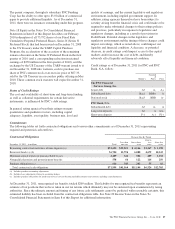
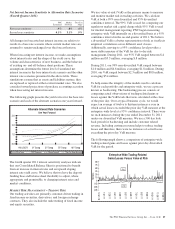
Total trading revenue was as follows:
Trading Revenue
Year ended December 31
In millions 2011 2010 2009
Net interest income $43 $55 $61
Noninterest income 225 183 170
Total trading revenue $268 $238 $231
Securities underwriting and trading (a) $81 $94 $75
Foreign exchange 88 76 73
Financial derivatives and other 99 68 83
Total trading revenue $268 $238 $231
(a) Includes changes in fair value for certain loans accounted for at fair value.
The trading revenue disclosed above includes results from
providing investing and risk management services to our
customers as well as results from hedges of customer activity.
Trading revenue excludes the impact of economic hedging
activities which we transact to manage risk primarily related
to residential mortgage servicing rights, residential and
commercial mortgage loans held-for-sale, and certain
residential mortgage-backed agency securities with embedded
derivatives. Derivatives used for economic hedges are not
designated as accounting hedges because the contracts they
are hedging are typically also carried at fair value on the
balance sheet, resulting in symmetrical accounting treatment
for both the hedging instrument and the hedged item.
Economic hedge results are reported in noninterest income
along with the associated hedge items.
Trading revenue for 2011 increased $30 million compared
with 2010 primarily due to higher derivatives and foreign
exchange client sales revenues, improved client related trading
results, and the reduced impact of counterparty credit risk on
valuations of derivative positions. These increases were
partially offset by lower underwriting activity.
Trading revenue increased $7 million in 2010 compared with
2009 primarily due to higher underwriting and derivatives
client sales revenue, partially offset by reduced proprietary
and customer related trading results. Proprietary trading
positions were essentially eliminated by the end of the second
quarter of 2010.
M
ARKET
R
ISK
M
ANAGEMENT
–E
QUITY
A
ND
O
THER
I
NVESTMENT
R
ISK
Equity investment risk is the risk of potential losses associated
with investing in both private and public equity markets. PNC
invests primarily in private equity markets. In addition to
extending credit, taking deposits, and underwriting and trading
financial instruments, we make and manage direct investments
in a variety of transactions, including management buyouts,
recapitalizations, and growth financings in a variety of
industries. We also have investments in affiliated and
non-affiliated funds that make similar investments in private
equity and in debt and equity-oriented hedge funds. The
economic and/or book value of these investments and other
assets such as loan servicing rights are directly affected by
changes in market factors.
The primary risk measurement for equity and other
investments is economic capital. Economic capital is a
common measure of risk for credit, market and operational
risk. It is an estimate of the potential value depreciation over a
one year horizon commensurate with solvency expectations of
an institution rated single-A by the credit rating agencies.
Given the illiquid nature of many of these types of
investments, it can be a challenge to determine their fair
values. See Note 8 Fair Value in the Notes To Consolidated
Financial Statements in Item 8 of this Report for additional
information.
Various PNC business units manage our equity and other
investment activities. Our businesses are responsible for
making investment decisions within the approved policy limits
and associated guidelines.
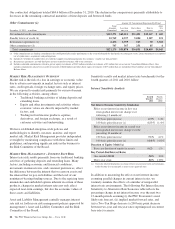
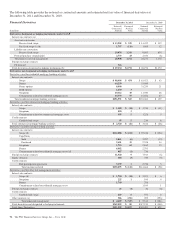
A summary of our equity investments follows:
In millions
Dec. 31
2011
Dec. 31
2010
BlackRock $ 5,291 $5,017
Tax credit investments 2,646 2,054
Private equity 1,491 1,375
Visa 456 456
Other 250 318
Total $10,134 $ 9,220
BlackRock
PNC owned approximately 36 million common stock
equivalent shares of BlackRock equity at December 31, 2011,
accounted for under the equity method. The primary risk
measurement, similar to other equity investments, is economic
capital. The Business Segments Review section of this Item 7
includes additional information about BlackRock.
Tax Credit Investments
Included in our equity investments are tax credit investments
which are accounted for under the equity method. These
investments, as well as equity investments held by
consolidated partnerships, totaled $2.6 billion at December 31,
2011 and $2.1 billion at December 31, 2010.
Private Equity
The private equity portfolio is an illiquid portfolio comprised
of mezzanine and equity investments that vary by industry,
stage and type of investment.
Private equity investments carried at estimated fair value
totaled $1.5 billion at December 31, 2011 and $1.4 billion at
December 31, 2010. As of December 31, 2011, $856 million
was invested directly in a variety of companies and $635
million was invested indirectly through various private equity
90 The PNC Financial Services Group, Inc. – Form 10-K