PNC Bank 2011 Annual Report Download - page 65
Download and view the complete annual report
Please find page 65 of the 2011 PNC Bank annual report below. You can navigate through the pages in the report by either clicking on the pages listed below, or by using the keyword search tool below to find specific information within the annual report.-
 1
1 -
2
-
3
-
4
-
5
-
6
-
7
-
8
-
9
-
10
-
11
-
12
-
13
-
14
-
15
-
16
-
17
-
18
-
19
-
20
-
21
-
22
-
23
-
24
-
25
-
26
-
27
-
28
-
29
-
30
-
31
-
32
-
33
-
34
-
35
-
36
-
37
-
38
-
39
-
40
-
41
-
42
-
43
-
44
-
45
-
46
-
47
-
48
-
49
-
50
-
51
-
52
-
53
-
54
-
 55
55 -
 56
56 -
 57
57 -
 58
58 -
 59
59 -
 60
60 -
 61
61 -
 62
62 -
 63
63 -
 64
64 -
 65
65 -
 66
66 -
 67
67 -
 68
68 -
 69
69 -
 70
70 -
 71
71 -
 72
72 -
 73
73 -
 74
74 -
 75
75 -
76
-
77
-
78
-
79
-
80
-
81
-
82
-
83
-
84
-
85
-
86
-
87
-
88
-
89
-
90
-
91
-
92
-
93
-
94
-
95
-
96
-
97
-
98
-
99
-
100
-
101
-
102
-
103
-
104
-
105
-
106
-
107
-
108
-
109
-
110
-
111
-
112
-
113
-
114
-
115
-
116
-
117
-
118
-
119
-
120
-
121
-
122
-
123
-
124
-
125
-
126
-
127
-
128
-
129
-
130
-
131
-
132
-
133
-
134
-
135
-
136
-
137
-
138
-
139
-
140
-
141
-
142
-
143
-
144
-
145
-
146
-
147
-
148
-
149
-
150
-
151
-
152
-
153
-
154
-
155
-
156
-
157
-
158
-
159
-
160
-
161
-
162
-
163
-
164
-
165
-
166
-
167
-
168
-
169
-
170
-
171
-
172
-
173
-
174
-
175
-
176
-
177
-
178
-
179
-
180
-
181
-
182
-
183
-
184
-
185
-
186
-
187
-
188
-
189
-
190
-
191
-
192
-
193
-
194
-
195
-
196
-
197
-
198
-
199
-
200
-
201
-
202
-
203
-
204
-
205
-
206
-
207
-
208
-
209
-
210
-
211
-
212
-
213
-
214
-
215
-
216
-
217
-
218
-
219
-
220
-
221
-
222
-
223
-
224
-
225
-
226
-
227
-
228
-
229
-
230
-
231
-
232
-
233
-
234
-
235
-
236
-
237
-
238
 |
 |
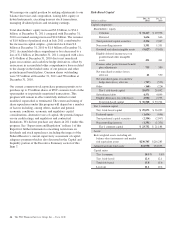
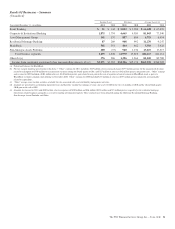
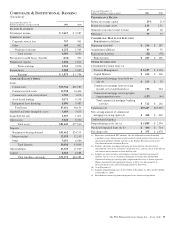
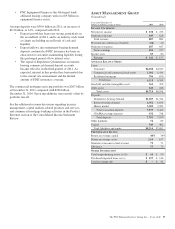
Corporate & Institutional Banking earned $1.9 billion in 2011
and $1.8 billion in 2010. The increase in earnings was
primarily due to an improvement in the provision for credit
losses, which was a benefit in 2011, partially offset by a
reduction in the value of commercial mortgage servicing
rights and lower net interest income. We continued to focus on
adding new clients, increasing cross sales, and remaining
committed to strong expense discipline.
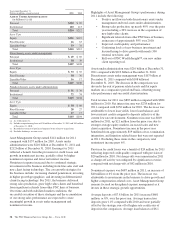
Highlights of Corporate & Institutional Banking’s
performance during 2011 include the following:
• Overall results benefited from successful sales efforts
to new clients and product penetration of the existing
customer base.
• New primary client acquisitions in Corporate
Banking of 1,165 exceeded the 1,000 new primary
clients goal for the year and represented a 15%
increase over 2010 new primary clients.
• Loan commitments increased 12% to $147 billion at
year end 2011, primarily in our Business Credit,
Healthcare, and Public Finance businesses.
• Loan balances have increased steadily each quarter
during 2011, including an increase in average loans
for the fourth quarter of 2011 of $8.8 billion or 14%,
compared to the fourth quarter of 2010.
• Our Treasury Management business, which ranks
among the top providers in the country, continued to
invest in markets, products and infrastructure as well
as major initiatives such as healthcare.
• Cross sales of treasury management and capital
markets products to customers in PNC’s markets
continued to be successful and were ahead of both
targets and 2010.
• Midland Loan Services, one of the leading third-party
providers of servicing for the commercial real estate
industry, received the highest U.S. servicer and
special servicer ratings from Fitch Ratings and
Standard & Poor’s for the 11th consecutive year.
• Midland Loan Services was the number one servicer
of FNMA and FHLMC multifamily and healthcare
loans and was the second leading servicer of
commercial and multifamily loans by volume as of
December 31, 2011 according to Mortgage Bankers
Association.
• Mergers and Acquisitions Journal named Harris
Williams & Co. Advisor of the Year in its March
2011 issue.
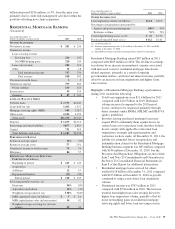
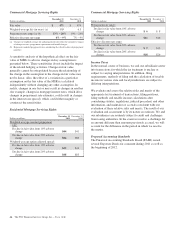
Net interest income in 2011 was $3.4 billion, a 5% decline
from 2010, reflecting lower purchase accounting accretion and
lower interest credits assigned to deposits, partially offset by
impacts from increases in average deposits and loans.
Corporate service fees were $767 million in 2011, a decrease
of $194 million from 2010, primarily due to a reduction in the
value of commercial mortgage servicing rights largely driven
by lower interest rates and higher loan prepayment rates, and
lower special servicing fees. The major components of
corporate service fees are treasury management, corporate
finance fees and commercial mortgage servicing revenue.
Other noninterest income was $485 million in 2011 compared
with $402 million in 2010. The increase of $83 million was
primarily due to valuations associated with the commercial
mortgage held-for-sale portfolio, higher revenue from multi-
family agency loan production and customer driven capital
markets activity.
The provision for credit losses was a benefit of $124 million
in 2011 compared with a provision of $303 million in 2010.
The improvement reflected continued positive migration in
portfolio credit quality which more than offset the impact of
higher loan and commitment levels. Net charge-offs in 2011
of $375 million decreased $699 million, or 65%, compared
with 2010. The decline was attributable primarily to the
commercial real estate and aviation portfolios. Nonperforming
assets declined for the seventh consecutive quarter, and at $1.9
billion represented a 27% decrease from December 31, 2010.
Noninterest expense was $1.8 billion in both 2011 and 2010.
Higher compensation-related costs were offset by the impact
of the sale of a duplicative agency servicing operation in 2010,
costs associated with aviation assets held for sale in 2010, and
lower legal expenses.
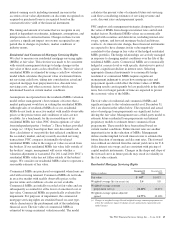
Average loans were $67.2 billion in 2011 compared with
$64.1 billion in 2010, an increase of 5%.
• The Corporate Banking business provides lending,
treasury management, and capital markets-related
products and services to mid-sized corporations,
government and not-for-profit entities, and
selectively to large corporations. Average loans for
this business increased $2.4 billion or 8% in 2011
compared with 2010. Loan commitments have
increased since the second quarter of 2010 due to
new customers and increased demand from existing
customers.
• PNC Real Estate provides commercial real estate and
real-estate related lending and is one of the industry’s
top providers of both conventional and affordable
multifamily financing. Average loans for this
business declined $1.1 billion or 7% in 2011
compared to 2010 due to loan sales, paydowns and
charge-offs, partially offset by improved originations.
• PNC Business Credit is one of the top asset-based
lenders in the country. The loan portfolio is relatively
high yielding, with moderate risk, as the loans are
mainly secured by liquid assets. Average loans
increased $1.9 billion or 30% in 2011 compared with
2010 due to customers seeking stable lending
sources, loan usage rates, and market expansion. We
expanded our operations with the acquisition of an
asset-based lending group in the United Kingdom,
completed in November 2010. Total loans acquired
were approximately $300 million.
56 The PNC Financial Services Group, Inc. – Form 10-K