PNC Bank 2011 Annual Report Download - page 63
Download and view the complete annual report
Please find page 63 of the 2011 PNC Bank annual report below. You can navigate through the pages in the report by either clicking on the pages listed below, or by using the keyword search tool below to find specific information within the annual report.-
 1
1 -
2
-
3
-
4
-
5
-
6
-
7
-
8
-
9
-
10
-
11
-
12
-
13
-
14
-
15
-
16
-
17
-
18
-
19
-
20
-
21
-
22
-
23
-
24
-
25
-
26
-
27
-
28
-
29
-
30
-
31
-
32
-
33
-
34
-
35
-
36
-
37
-
38
-
39
-
40
-
41
-
42
-
43
-
44
-
45
-
46
-
47
-
48
-
49
-
50
-
51
-
52
-
 53
53 -
 54
54 -
 55
55 -
 56
56 -
 57
57 -
 58
58 -
 59
59 -
 60
60 -
 61
61 -
 62
62 -
 63
63 -
 64
64 -
 65
65 -
 66
66 -
 67
67 -
 68
68 -
 69
69 -
 70
70 -
 71
71 -
 72
72 -
 73
73 -
74
-
75
-
76
-
77
-
78
-
79
-
80
-
81
-
82
-
83
-
84
-
85
-
86
-
87
-
88
-
89
-
90
-
91
-
92
-
93
-
94
-
95
-
96
-
97
-
98
-
99
-
100
-
101
-
102
-
103
-
104
-
105
-
106
-
107
-
108
-
109
-
110
-
111
-
112
-
113
-
114
-
115
-
116
-
117
-
118
-
119
-
120
-
121
-
122
-
123
-
124
-
125
-
126
-
127
-
128
-
129
-
130
-
131
-
132
-
133
-
134
-
135
-
136
-
137
-
138
-
139
-
140
-
141
-
142
-
143
-
144
-
145
-
146
-
147
-
148
-
149
-
150
-
151
-
152
-
153
-
154
-
155
-
156
-
157
-
158
-
159
-
160
-
161
-
162
-
163
-
164
-
165
-
166
-
167
-
168
-
169
-
170
-
171
-
172
-
173
-
174
-
175
-
176
-
177
-
178
-
179
-
180
-
181
-
182
-
183
-
184
-
185
-
186
-
187
-
188
-
189
-
190
-
191
-
192
-
193
-
194
-
195
-
196
-
197
-
198
-
199
-
200
-
201
-
202
-
203
-
204
-
205
-
206
-
207
-
208
-
209
-
210
-
211
-
212
-
213
-
214
-
215
-
216
-
217
-
218
-
219
-
220
-
221
-
222
-
223
-
224
-
225
-
226
-
227
-
228
-
229
-
230
-
231
-
232
-
233
-
234
-
235
-
236
-
237
-
238
 |
 |
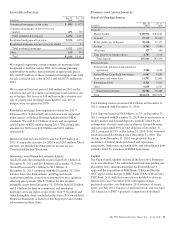
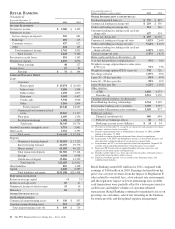
markets for growth, and focus on the retention and growth of
balances for relationship customers.
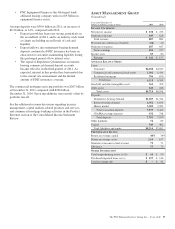
In 2011, average total deposits of $122.5 billion decreased
$3.1 billion, or 2%, compared with 2010.
• Average demand deposits increased $3.4 billion, or
9%, over 2010. The increase was primarily driven by
customer growth and customer preferences for
liquidity.
• Average money market deposits increased $877
million, or 2%, from 2010. The increase was
primarily due to core money market growth as
customers generally preferred more liquid deposits in
a low rate environment.
• Average savings deposits increased $1.2 billion, or
17%, over 2010. The increase was attributable to net
customer growth and new product offerings.
• Average consumer certificates of deposit decreased
$8.5 billion or 21% from 2010. The decline is
expected to continue through 2012 due to the
continued run-off of higher rate certificates of
deposit.
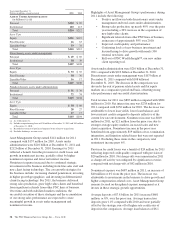
Currently, our primary focus is on a relationship-based
lending strategy that targets specific customer sectors
including mass and mass affluent consumers, small businesses
and auto dealerships. In 2011, average total loans were $58.3
billion, a decrease of $429 million, or 1%, over 2010.
• Average indirect auto loans increased $991 million,
or 47%, over 2010. The increase was due to the
expansion of our indirect sales force and product
introduction to acquired markets, as well as overall
increases in auto sales.
• Average education loans grew $606 million, or 7%,
compared with 2010, primarily due to portfolio
purchases in December 2010, July 2011, and
November 2011 of approximately $450 million, $445
million, and $560 million, respectively.
• Average auto dealer floor plan loans grew $114
million, or 9%, compared with 2010, primarily
resulting from additional dealer relationships and
higher line utilization.
• Average credit card balances decreased $200 million,
or 5%, over 2010. The decrease was primarily the
result of fewer active accounts generating balances
coupled with increased paydowns on existing
accounts.
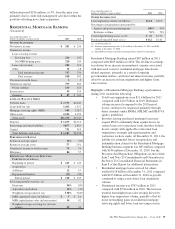
• Average commercial and commercial real estate
loans declined $610 million, or 5%, compared with
2010. The decline was primarily due to refinancings,
paydowns, and charge-offs outpacing loan demand.
• Average home equity loans declined $576 million, or
2%, compared with 2010. Home equity loan demand
remained soft in the current economic climate. The
decline is driven by loan demand being outpaced by
paydowns, refinancings, and charge-offs. Retail
Banking’s home equity loan portfolio is relationship
based, with 96% of the portfolio attributable to
borrowers in our primary geographic footprint. The
nonperforming assets and charge-offs that we have
experienced are within our expectations given current
market conditions.
• Average indirect other and residential mortgages are
primarily run-off portfolios and declined $397
million and $419 million, respectively, compared
with 2010. The indirect other portfolio is comprised
of marine, RV, and other indirect loan products.
54 The PNC Financial Services Group, Inc. – Form 10-K