PNC Bank 2011 Annual Report Download - page 42
Download and view the complete annual report
Please find page 42 of the 2011 PNC Bank annual report below. You can navigate through the pages in the report by either clicking on the pages listed below, or by using the keyword search tool below to find specific information within the annual report.-
 1
1 -
2
-
3
-
4
-
5
-
6
-
7
-
8
-
9
-
10
-
11
-
12
-
13
-
14
-
15
-
16
-
17
-
18
-
19
-
20
-
21
-
22
-
23
-
24
-
25
-
26
-
27
-
28
-
29
-
30
-
31
-
 32
32 -
 33
33 -
 34
34 -
 35
35 -
 36
36 -
 37
37 -
 38
38 -
 39
39 -
 40
40 -
 41
41 -
 42
42 -
 43
43 -
 44
44 -
 45
45 -
 46
46 -
 47
47 -
 48
48 -
 49
49 -
 50
50 -
 51
51 -
 52
52 -
53
-
54
-
55
-
56
-
57
-
58
-
59
-
60
-
61
-
62
-
63
-
64
-
65
-
66
-
67
-
68
-
69
-
70
-
71
-
72
-
73
-
74
-
75
-
76
-
77
-
78
-
79
-
80
-
81
-
82
-
83
-
84
-
85
-
86
-
87
-
88
-
89
-
90
-
91
-
92
-
93
-
94
-
95
-
96
-
97
-
98
-
99
-
100
-
101
-
102
-
103
-
104
-
105
-
106
-
107
-
108
-
109
-
110
-
111
-
112
-
113
-
114
-
115
-
116
-
117
-
118
-
119
-
120
-
121
-
122
-
123
-
124
-
125
-
126
-
127
-
128
-
129
-
130
-
131
-
132
-
133
-
134
-
135
-
136
-
137
-
138
-
139
-
140
-
141
-
142
-
143
-
144
-
145
-
146
-
147
-
148
-
149
-
150
-
151
-
152
-
153
-
154
-
155
-
156
-
157
-
158
-
159
-
160
-
161
-
162
-
163
-
164
-
165
-
166
-
167
-
168
-
169
-
170
-
171
-
172
-
173
-
174
-
175
-
176
-
177
-
178
-
179
-
180
-
181
-
182
-
183
-
184
-
185
-
186
-
187
-
188
-
189
-
190
-
191
-
192
-
193
-
194
-
195
-
196
-
197
-
198
-
199
-
200
-
201
-
202
-
203
-
204
-
205
-
206
-
207
-
208
-
209
-
210
-
211
-
212
-
213
-
214
-
215
-
216
-
217
-
218
-
219
-
220
-
221
-
222
-
223
-
224
-
225
-
226
-
227
-
228
-
229
-
230
-
231
-
232
-
233
-
234
-
235
-
236
-
237
-
238
 |
 |

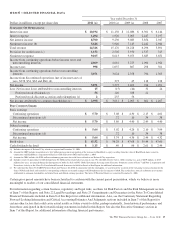
Our performance in 2011 included the following:
• Net income for 2011 of $3.1 billion was down 10%
from 2010. Results for 2011 included $324 million for
residential mortgage foreclosure-related expenses
primarily as a result of ongoing governmental matters
and a noncash charge of $198 million related to the
redemption of trust preferred securities. Results for
2010 included $71 million of residential mortgage-
related expenses, $328 million after-tax gain on our
sale of GIS, and integration expenses of $387 million,
whereas the comparable amount of integration
expenses for 2011 was $42 million. For 2010, net
income attributable to common shareholders and
diluted earnings per common share were impacted by
a noncash reduction of $250 million related to our
redemption of TARP preferred stock.
• Net interest income of $8.7 billion for 2011 was
down 6% from 2010; net interest margin was down
to 3.92% in 2011 compared with 4.14% for 2010
primarily due to the impact of lower purchase
accounting accretion, a decline in average loan
balances and the low interest rate environment.
• Noninterest income of $5.6 billion in 2011 declined
5% compared with 2010. Noninterest income for 2011
reflected higher asset management fees that were
offset by lower corporate service fees primarily due to
a reduction in the value of commercial mortgage
servicing rights and the impact of the rules set forth in
Regulation E. The fourth quarter impact of Dodd-
Frank on interchange revenue was offset by increased
customer-initiated volumes throughout 2011.
• The provision for credit losses declined to $1.2
billion in 2011 compared with $2.5 billion in 2010 as
overall credit quality continued to improve due to
slowly improving economic conditions and actions
we took to reduce exposure levels during the year.
• Noninterest expense for 2011 increased by 6%
compared with 2010, to $9.1 billion primarily due to
higher residential mortgage foreclosure-related
expenses and a charge for the unamortized discount
related to the redemption of trust preferred securities.
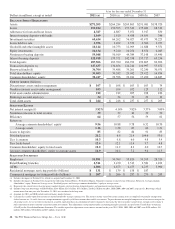
• Overall credit quality continued to improve during
2011. Nonperforming assets declined $967 million,
or 19%, to $4.2 billion as of December 31, 2011 from
December 31, 2010. Accruing loans past due
increased $12 million, or less than 1%, during 2011
to $4.5 billion at year end primarily attributable to
government insured or guaranteed loans. The
allowance for loan and lease losses (ALLL) was $4.3
billion, or 2.73% of total loans and 122% of
nonperforming loans, as of December 31, 2011.
• We remain committed to responsible lending to
support economic growth. Total loan originations and
new commitments and renewals totaled
approximately $147 billion for 2011, including $4.1
billion of small business loans. Total loans were
$159.0 billion at December 31, 2011, an increase of
6% from $150.6 billion at December 31, 2010. The
growth in total loans exceeded the $2.4 billion
decrease in Non-Strategic Assets Portfolio loans
driven by customer payment activity and portfolio
management activities to reduce under-performing
assets. Consolidated growth in commercial loans of
$10.5 billion, auto loans of $2.2 billion, and
education loans of $.4 billion was partially offset by
declines of $1.7 billion in commercial real estate
loans, $1.5 billion of residential real estate loans and
$1.1 billion of home equity loans compared with
December 31, 2010. The $3.2 billion decrease in
consolidated commercial and residential real estate
loans included $1.4 billion of Non-Strategic Assets
• Portfolio loans, accounting for approximately 43% of
the consolidated decline.
• Total deposits were $188.0 billion at December 31,
2011 compared with $183.4 billion at the prior year
end. Growth in transaction deposits (interest-bearing
money market, interest-bearing demand and
noninterest-bearing) continued with an increase of
$13 billion, or 10%, for the year. Retail certificates of
deposit were reduced by $7.8 billion, or 21%, during
2011 and deposit costs were 51 basis points, which
was 19 basis points lower than in 2010.
• Our higher quality balance sheet during 2011
reflected core funding with a loans to deposits ratio
of 85% at year end and strong bank and holding
company liquidity positions to support growth.
• We grew common shareholders’ equity by $2.8
billion during 2011. The Tier 1 common capital ratio
was 10.3% at December 31, 2011, up 50 basis points
from December 31, 2010.
Our Consolidated Income Statement Review section of this
Item 7 describes in greater detail the various items that
impacted our results for 2011 and 2010.
B
ALANCE
S
HEET
H
IGHLIGHTS
Total assets were $271.2 billion at December 31, 2011
compared with $264.3 billion at December 31, 2010. The
increase from year end 2010 resulted primarily from an
increase in loans and other assets somewhat offset by a
decrease in investment securities and short term investments.
Various seasonal and other factors impact our period-end
balances whereas average balances are generally more
indicative of underlying business trends apart from the impact
of acquisitions and divestitures. The Consolidated Balance
Sheet Review section of this Item 7 provides information on
changes in selected Consolidated Balance Sheet categories at
December 31, 2011 compared with December 31, 2010.
Total average assets were $265.3 billion for 2011 compared
with $264.9 billion for 2010. Average interest-earning assets
were $224.3 billion for 2011, compared with $224.7 billion in
2010. Both comparisons were primarily driven by a $1.8
The PNC Financial Services Group, Inc. – Form 10-K 33