PNC Bank 2011 Annual Report Download - page 182
Download and view the complete annual report
Please find page 182 of the 2011 PNC Bank annual report below. You can navigate through the pages in the report by either clicking on the pages listed below, or by using the keyword search tool below to find specific information within the annual report.-
 1
1 -
2
-
3
-
4
-
5
-
6
-
7
-
8
-
9
-
10
-
11
-
12
-
13
-
14
-
15
-
16
-
17
-
18
-
19
-
20
-
21
-
22
-
23
-
24
-
25
-
26
-
27
-
28
-
29
-
30
-
31
-
32
-
33
-
34
-
35
-
36
-
37
-
38
-
39
-
40
-
41
-
42
-
43
-
44
-
45
-
46
-
47
-
48
-
49
-
50
-
51
-
52
-
53
-
54
-
55
-
56
-
57
-
58
-
59
-
60
-
61
-
62
-
63
-
64
-
65
-
66
-
67
-
68
-
69
-
70
-
71
-
72
-
73
-
74
-
75
-
76
-
77
-
78
-
79
-
80
-
81
-
82
-
83
-
84
-
85
-
86
-
87
-
88
-
89
-
90
-
91
-
92
-
93
-
94
-
95
-
96
-
97
-
98
-
99
-
100
-
101
-
102
-
103
-
104
-
105
-
106
-
107
-
108
-
109
-
110
-
111
-
112
-
113
-
114
-
115
-
116
-
117
-
118
-
119
-
120
-
121
-
122
-
123
-
124
-
125
-
126
-
127
-
128
-
129
-
130
-
131
-
132
-
133
-
134
-
135
-
136
-
137
-
138
-
139
-
140
-
141
-
142
-
143
-
144
-
145
-
146
-
147
-
148
-
149
-
150
-
151
-
152
-
153
-
154
-
155
-
156
-
157
-
158
-
159
-
160
-
161
-
162
-
163
-
164
-
165
-
166
-
167
-
168
-
169
-
170
-
171
-
 172
172 -
 173
173 -
 174
174 -
 175
175 -
 176
176 -
 177
177 -
 178
178 -
 179
179 -
 180
180 -
 181
181 -
 182
182 -
 183
183 -
 184
184 -
 185
185 -
 186
186 -
 187
187 -
 188
188 -
 189
189 -
 190
190 -
 191
191 -
 192
192 -
193
-
194
-
195
-
196
-
197
-
198
-
199
-
200
-
201
-
202
-
203
-
204
-
205
-
206
-
207
-
208
-
209
-
210
-
211
-
212
-
213
-
214
-
215
-
216
-
217
-
218
-
219
-
220
-
221
-
222
-
223
-
224
-
225
-
226
-
227
-
228
-
229
-
230
-
231
-
232
-
233
-
234
-
235
-
236
-
237
-
238
 |
 |

N
ONQUALIFIED
S
TOCK
O
PTIONS
Options are granted at exercise prices not less than the market
value of common stock on the grant date. Generally, options
become exercisable in installments after the grant date. No
option may be exercisable after 10 years from its grant date.
Payment of the option exercise price may be in cash or by
surrendering shares of common stock at market value on the
exercise date. The exercise price may be paid in previously
owned shares.
Generally, options granted under the Incentive Plans vest
ratably over a three-year period as long as the grantee remains
an employee or, in certain cases, retires from PNC. In
accordance with FASB ASC 718, Stock Compensation,we
recognize compensation expense for options granted to
retirement-eligible employees during the first twelve months
subsequent to the grant, in accordance with the service period
provisions of the options.
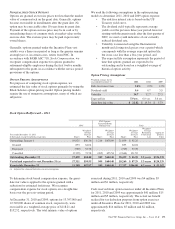
O
PTION
P
RICING
A
SSUMPTIONS
For purposes of computing stock option expense, we
estimated the fair value of stock options primarily by using the
Black-Scholes option-pricing model. Option pricing models
require the use of numerous assumptions, many of which are
subjective.
We used the following assumptions in the option pricing
models to determine 2011, 2010 and 2009 option expense:
• The risk-free interest rate is based on the US
Treasury yield curve,
• The dividend yield typically represents average
yields over the previous three-year period, however
starting with the grants made after the first quarter of
2009, we used a yield indicative of our currently
reduced dividend rate,
• Volatility is measured using the fluctuation in
month-end closing stock prices over a period which
corresponds with the average expected option life,
but in no case less than a five-year period, and
• The expected life assumption represents the period of
time that options granted are expected to be
outstanding and is based on a weighted-average of
historical option activity.
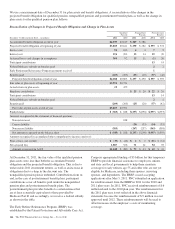
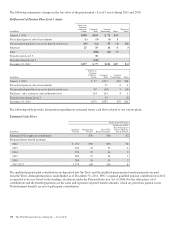
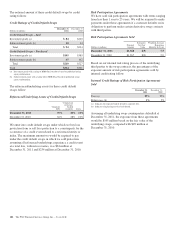
Option Pricing Assumptions
Weighted-average for the
year ended December 31 2011 2010 2009
Risk-free interest rate 2.8% 2.9% 1.9%
Dividend yield 0.6 0.7 3.5
Volatility 34.7 32.7 27.3
Expected life 5.9 yrs. 6.0 yrs. 5.6 yrs.
Grant date fair value $ 22.82 $ 19.54 $ 5.73
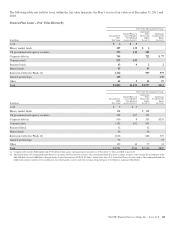
Stock Option Rollforward – 2011
PNC
PNC Options
Converted From
National City Total
Year ended December 31, 2011
In thousands, except weighted-average data Shares
Weighted-
Average
Exercise
Price Shares
Weighted-
Average
Exercise
Price Shares
Weighted-
Average
Exercise
Price
Weighted-
Average
Remaining
Contractual
Life
Aggregate
Intrinsic
Value
Outstanding, January 1 19,825 $56.36 1,214 $678.09 21,039 $ 92.25
Granted 833 64.04 833 64.04
Exercised (769) 53.78 (769) 53.78
Cancelled (2,399) 73.58 (265) 655.54 (2,664) 131.52
Outstanding, December 31 17,490 $54.48 949 $684.40 18,439 $ 86.90 5.3 years $126,535
Vested and expected to vest, December 31 (a) 17,311 $54.55 949 $684.40 18,260 $ 87.29 5.3 years $124,339
Exercisable, December 31 11,388 $57.87 949 $684.40 12,337 $106.08 4.2 years $ 53,567
(a) Adjusted for estimated forfeitures on unvested options.
To determine stock-based compensation expense, the grant-
date fair value is applied to the options granted with a
reduction for estimated forfeitures. We recognize
compensation expense for stock options on a straight-line
basis over the pro rata vesting period.
At December 31, 2010 and 2009, options for 13,397,000 and
12,722,000 shares of common stock, respectively, were
exercisable at a weighted-average price of $118.21 and
$132.52, respectively. The total intrinsic value of options
exercised during 2011, 2010 and 2009 was $4 million, $5
million and $1 million, respectively.
Cash received from option exercises under all Incentive Plans
for 2011, 2010 and 2009 was approximately $41 million, $15
million and $5 million, respectively. The actual tax benefit
realized for tax deduction purposes from option exercises
under all Incentive Plans for 2011, 2010 and 2009 was
approximately $14 million, $5 million and $2 million,
respectively.
The PNC Financial Services Group, Inc. – Form 10-K 173