PNC Bank 2011 Annual Report Download - page 64
Download and view the complete annual report
Please find page 64 of the 2011 PNC Bank annual report below. You can navigate through the pages in the report by either clicking on the pages listed below, or by using the keyword search tool below to find specific information within the annual report.-
 1
1 -
2
-
3
-
4
-
5
-
6
-
7
-
8
-
9
-
10
-
11
-
12
-
13
-
14
-
15
-
16
-
17
-
18
-
19
-
20
-
21
-
22
-
23
-
24
-
25
-
26
-
27
-
28
-
29
-
30
-
31
-
32
-
33
-
34
-
35
-
36
-
37
-
38
-
39
-
40
-
41
-
42
-
43
-
44
-
45
-
46
-
47
-
48
-
49
-
50
-
51
-
52
-
53
-
 54
54 -
 55
55 -
 56
56 -
 57
57 -
 58
58 -
 59
59 -
 60
60 -
 61
61 -
 62
62 -
 63
63 -
 64
64 -
 65
65 -
 66
66 -
 67
67 -
 68
68 -
 69
69 -
 70
70 -
 71
71 -
 72
72 -
 73
73 -
 74
74 -
75
-
76
-
77
-
78
-
79
-
80
-
81
-
82
-
83
-
84
-
85
-
86
-
87
-
88
-
89
-
90
-
91
-
92
-
93
-
94
-
95
-
96
-
97
-
98
-
99
-
100
-
101
-
102
-
103
-
104
-
105
-
106
-
107
-
108
-
109
-
110
-
111
-
112
-
113
-
114
-
115
-
116
-
117
-
118
-
119
-
120
-
121
-
122
-
123
-
124
-
125
-
126
-
127
-
128
-
129
-
130
-
131
-
132
-
133
-
134
-
135
-
136
-
137
-
138
-
139
-
140
-
141
-
142
-
143
-
144
-
145
-
146
-
147
-
148
-
149
-
150
-
151
-
152
-
153
-
154
-
155
-
156
-
157
-
158
-
159
-
160
-
161
-
162
-
163
-
164
-
165
-
166
-
167
-
168
-
169
-
170
-
171
-
172
-
173
-
174
-
175
-
176
-
177
-
178
-
179
-
180
-
181
-
182
-
183
-
184
-
185
-
186
-
187
-
188
-
189
-
190
-
191
-
192
-
193
-
194
-
195
-
196
-
197
-
198
-
199
-
200
-
201
-
202
-
203
-
204
-
205
-
206
-
207
-
208
-
209
-
210
-
211
-
212
-
213
-
214
-
215
-
216
-
217
-
218
-
219
-
220
-
221
-
222
-
223
-
224
-
225
-
226
-
227
-
228
-
229
-
230
-
231
-
232
-
233
-
234
-
235
-
236
-
237
-
238
 |
 |

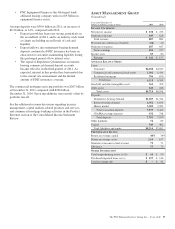
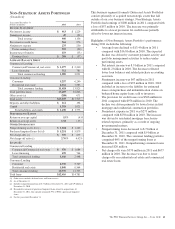
C
ORPORATE
&I
NSTITUTIONAL
B
ANKING
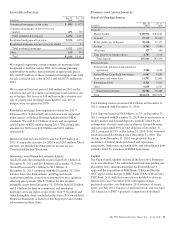
(Unaudited)
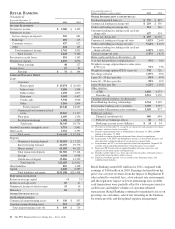
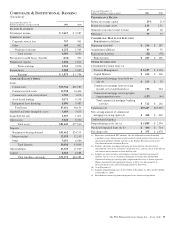
Year ended December 31
Dollars in millions, except as noted 2011 2010
I
NCOME
S
TATEMENT
Net interest income $ 3,417 $ 3,587
Noninterest income
Corporate service fees 767 961
Other 485 402
Noninterest income 1,252 1,363
Total revenue 4,669 4,950
Provision for credit losses (benefit) (124) 303
Noninterest expense 1,830 1,821
Pretax earnings 2,963 2,826
Income taxes 1,088 1,032
Earnings $ 1,875 $ 1,794
A
VERAGE
B
ALANCE
S
HEET
Loans
Commercial $35,764 $32,787
Commercial real estate 13,938 16,466
Commercial – real estate related 3,782 3,076
Asset-based lending 8,171 6,318
Equipment lease financing 5,506 5,487
Total loans 67,161 64,134
Goodwill and other intangible assets 3,405 3,613
Loans held for sale 1,257 1,473
Other assets 9,220 8,320
Total assets $81,043 $77,540
Deposits
Noninterest-bearing demand $31,462 $24,713
Money market 12,925 12,153
Other 5,651 6,980
Total deposits 50,038 43,846
Other liabilities 13,323 11,949
Capital 8,010 8,588
Total liabilities and equity $71,371 $64,383
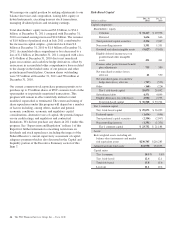
Year ended December 31
Dollars in millions, except as noted 2011 2010
P
ERFORMANCE
R
ATIOS
Return on average capital 23% 21%
Return on average assets 2.31 2.31
Noninterest income to total revenue 27 28
Efficiency 39 37
C
OMMERCIAL
M
ORTGAGE
S
ERVICING
P
ORTFOLIO
(in billions)
Beginning of period $ 266 $ 287
Acquisitions/additions 43 35
Repayments/transfers (42) (56)
End of period $ 267 $ 266
O
THER
I
NFORMATION
Consolidated revenue from: (a)
Treasury Management $ 1,187 $ 1,220
Capital Markets $ 622 $ 606
Commercial mortgage loans held for
sale (b) $ 113 $58
Commercial mortgage loan servicing
income, net of amortization (c) 156 244
Commercial mortgage servicing rights
(impairment)/recovery (157) (40)
Total commercial mortgage banking
activities $ 112 $ 262
Total loans (d) $73,417 $63,695
Net carrying amount of commercial
mortgage servicing rights (d) $ 468 $ 665
Credit-related statistics:
Nonperforming assets (d) (e) $ 1,889 $ 2,594
Purchased impaired loans (d) (f) $ 404 $ 714
Net charge-offs $ 375 $ 1,074
(a) Represents consolidated PNC amounts. See the additional revenue discussion
regarding treasury management, capital markets-related products and services, and
commercial mortgage banking activities in the Product Revenue section of the
Consolidated Income Statement Review.
(b) Includes valuations on commercial mortgage loans held for sale and related
commitments, derivatives valuations, origination fees, gains on sale of loans held for
sale and net interest income on loans held for sale.
(c) Includes net interest income and noninterest income from loan servicing and
ancillary services, net of commercial mortgage servicing rights amortization.
Commercial mortgage servicing rights (impairment)/recovery is shown separately.
Higher amortization and impairment charges in 2011 were due primarily to
decreased interest rates and related prepayments by borrowers.
(d) As of December 31.
(e) Includes nonperforming loans of $1.7 billion at December 31, 2011 and $2.4 billion
at December 31, 2010.
(f) Recorded investment of purchased impaired loans related to acquisitions.
The PNC Financial Services Group, Inc. – Form 10-K 55