PNC Bank 2011 Annual Report Download - page 160
Download and view the complete annual report
Please find page 160 of the 2011 PNC Bank annual report below. You can navigate through the pages in the report by either clicking on the pages listed below, or by using the keyword search tool below to find specific information within the annual report.-
 1
1 -
2
-
3
-
4
-
5
-
6
-
7
-
8
-
9
-
10
-
11
-
12
-
13
-
14
-
15
-
16
-
17
-
18
-
19
-
20
-
21
-
22
-
23
-
24
-
25
-
26
-
27
-
28
-
29
-
30
-
31
-
32
-
33
-
34
-
35
-
36
-
37
-
38
-
39
-
40
-
41
-
42
-
43
-
44
-
45
-
46
-
47
-
48
-
49
-
50
-
51
-
52
-
53
-
54
-
55
-
56
-
57
-
58
-
59
-
60
-
61
-
62
-
63
-
64
-
65
-
66
-
67
-
68
-
69
-
70
-
71
-
72
-
73
-
74
-
75
-
76
-
77
-
78
-
79
-
80
-
81
-
82
-
83
-
84
-
85
-
86
-
87
-
88
-
89
-
90
-
91
-
92
-
93
-
94
-
95
-
96
-
97
-
98
-
99
-
100
-
101
-
102
-
103
-
104
-
105
-
106
-
107
-
108
-
109
-
110
-
111
-
112
-
113
-
114
-
115
-
116
-
117
-
118
-
119
-
120
-
121
-
122
-
123
-
124
-
125
-
126
-
127
-
128
-
129
-
130
-
131
-
132
-
133
-
134
-
135
-
136
-
137
-
138
-
139
-
140
-
141
-
142
-
143
-
144
-
145
-
146
-
147
-
148
-
149
-
 150
150 -
 151
151 -
 152
152 -
 153
153 -
 154
154 -
 155
155 -
 156
156 -
 157
157 -
 158
158 -
 159
159 -
 160
160 -
 161
161 -
 162
162 -
 163
163 -
 164
164 -
 165
165 -
 166
166 -
 167
167 -
 168
168 -
 169
169 -
 170
170 -
171
-
172
-
173
-
174
-
175
-
176
-
177
-
178
-
179
-
180
-
181
-
182
-
183
-
184
-
185
-
186
-
187
-
188
-
189
-
190
-
191
-
192
-
193
-
194
-
195
-
196
-
197
-
198
-
199
-
200
-
201
-
202
-
203
-
204
-
205
-
206
-
207
-
208
-
209
-
210
-
211
-
212
-
213
-
214
-
215
-
216
-
217
-
218
-
219
-
220
-
221
-
222
-
223
-
224
-
225
-
226
-
227
-
228
-
229
-
230
-
231
-
232
-
233
-
234
-
235
-
236
-
237
-
238
 |
 |

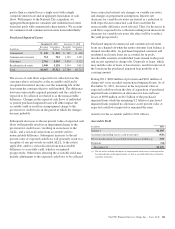
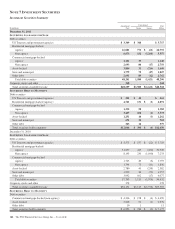
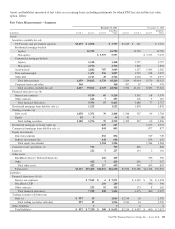
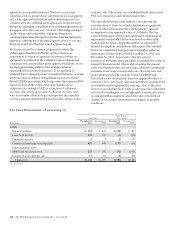
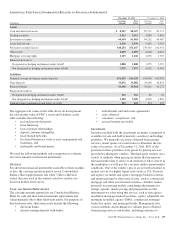
Assets and liabilities measured at fair value on a recurring basis, including instruments for which PNC has elected the fair value
option, follow.
Fair Value Measurements – Summary
December 31, 2011 December 31, 2010
In millions Level 1 Level 2 Level 3
Total Fair
Value Level 1 Level 2 Level 3
Total Fair
Value
Assets
Securities available for sale
US Treasury and government agencies $1,659 $ 2,058 $ 3,717 $5,289 $ 421 $ 5,710
Residential mortgage-backed
Agency 26,792 26,792 31,720 31,720
Non-agency $ 5,557 5,557 $ 7,233 7,233
Commercial mortgage-backed
Agency 1,140 1,140 1,797 1,797
Non-agency 2,756 2,756 1,856 1,856
Asset-backed 2,882 787 3,669 1,537 1,045 2,582
State and municipal 1,471 336 1,807 1,729 228 1,957
Other debt 2,713 49 2,762 4,004 73 4,077
Total debt securities 1,659 39,812 6,729 48,200 5,289 43,064 8,579 56,932
Corporate stocks and other 368 368 307 67 4 378
Total securities available for sale 2,027 39,812 6,729 48,568 5,596 43,131 8,583 57,310
Financial derivatives (a) (b)
Interest rate contracts 9,150 60 9,210 5,502 68 5,570
Other contracts 246 7 253 178 9 187
Total financial derivatives 9,396 67 9,463 5,680 77 5,757
Residential mortgage loans held for sale (c) 1,522 1,522 1,878 1,878
Trading securities (d)
Debt (e) (f) 1,058 1,371 39 2,468 1,348 367 69 1,784
Equity 42 3 45 42 42
Total trading securities 1,100 1,374 39 2,513 1,390 367 69 1,826
Residential mortgage servicing rights (g) 647 647 1,033 1,033
Commercial mortgage loans held for sale (c) 843 843 877 877
Equity investments
Direct investments 856 856 749 749
Indirect investments (h) 648 648 635 635
Total equity investments 1,504 1,504 1,384 1,384
Customer resale agreements (i) 732 732 866 866
Loans (j) 222 5 227 114 2 116
Other assets
BlackRock Series C Preferred Stock (k) 210 210 396 396
Other 422 7 429 450 7 457
Total other assets 422 217 639 450 403 853
Total assets $3,127 $53,480 $10,051 $66,658 $6,986 $52,486 $12,428 $71,900
Liabilities
Financial derivatives (b) (l)
Interest rate contracts $ 7,065 $ 6 $ 7,071 $ 4,302 $ 56 $ 4,358
BlackRock LTIP 210 210 396 396
Other contracts 233 92 325 173 8 181
Total financial derivatives 7,298 308 7,606 4,475 460 4,935
Trading securities sold short (m)
Debt (e) $ 997 19 1,016 $2,514 16 2,530
Total trading securities sold short 997 19 1,016 2,514 16 2,530
Other liabilities 3366
Total liabilities $ 997 $ 7,320 $ 308 $ 8,625 $2,514 $ 4,497 $ 460 $ 7,471
The PNC Financial Services Group, Inc. – Form 10-K 151