PNC Bank 2011 Annual Report Download - page 168
Download and view the complete annual report
Please find page 168 of the 2011 PNC Bank annual report below. You can navigate through the pages in the report by either clicking on the pages listed below, or by using the keyword search tool below to find specific information within the annual report.-
 1
1 -
2
-
3
-
4
-
5
-
6
-
7
-
8
-
9
-
10
-
11
-
12
-
13
-
14
-
15
-
16
-
17
-
18
-
19
-
20
-
21
-
22
-
23
-
24
-
25
-
26
-
27
-
28
-
29
-
30
-
31
-
32
-
33
-
34
-
35
-
36
-
37
-
38
-
39
-
40
-
41
-
42
-
43
-
44
-
45
-
46
-
47
-
48
-
49
-
50
-
51
-
52
-
53
-
54
-
55
-
56
-
57
-
58
-
59
-
60
-
61
-
62
-
63
-
64
-
65
-
66
-
67
-
68
-
69
-
70
-
71
-
72
-
73
-
74
-
75
-
76
-
77
-
78
-
79
-
80
-
81
-
82
-
83
-
84
-
85
-
86
-
87
-
88
-
89
-
90
-
91
-
92
-
93
-
94
-
95
-
96
-
97
-
98
-
99
-
100
-
101
-
102
-
103
-
104
-
105
-
106
-
107
-
108
-
109
-
110
-
111
-
112
-
113
-
114
-
115
-
116
-
117
-
118
-
119
-
120
-
121
-
122
-
123
-
124
-
125
-
126
-
127
-
128
-
129
-
130
-
131
-
132
-
133
-
134
-
135
-
136
-
137
-
138
-
139
-
140
-
141
-
142
-
143
-
144
-
145
-
146
-
147
-
148
-
149
-
150
-
151
-
152
-
153
-
154
-
155
-
156
-
157
-
 158
158 -
 159
159 -
 160
160 -
 161
161 -
 162
162 -
 163
163 -
 164
164 -
 165
165 -
 166
166 -
 167
167 -
 168
168 -
 169
169 -
 170
170 -
 171
171 -
 172
172 -
 173
173 -
 174
174 -
 175
175 -
 176
176 -
 177
177 -
 178
178 -
179
-
180
-
181
-
182
-
183
-
184
-
185
-
186
-
187
-
188
-
189
-
190
-
191
-
192
-
193
-
194
-
195
-
196
-
197
-
198
-
199
-
200
-
201
-
202
-
203
-
204
-
205
-
206
-
207
-
208
-
209
-
210
-
211
-
212
-
213
-
214
-
215
-
216
-
217
-
218
-
219
-
220
-
221
-
222
-
223
-
224
-
225
-
226
-
227
-
228
-
229
-
230
-
231
-
232
-
233
-
234
-
235
-
236
-
237
-
238
 |
 |

N
OTE
9G
OODWILL AND
O
THER
I
NTANGIBLE
A
SSETS
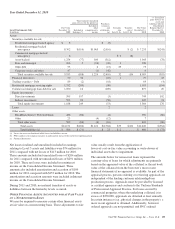
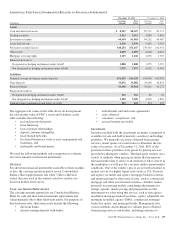
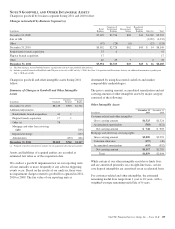
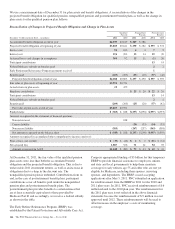
Changes in goodwill by business segment during 2011 and 2010 follow:
Changes in Goodwill by Business Segment (a)
In millions
Retail
Banking
Corporate &
Institutional
Banking
Asset
Management
Group
Residential
Mortgage
Banking Other (b) Total
December 31, 2009 $5,369 $2,756 $68 $43 $1,269 $9,505
Sale of GIS (1,232) (1,232)
Other (67) (28) (6) (23) (124)
December 31, 2010 $5,302 $2,728 $62 $43 $ 14 $8,149
BankAtlantic branch acquisition 35 6 41
Flagstar branch acquisition 17 17
Other 40 29 7 2 78
December 31, 2011 $5,394 $2,763 $69 $43 $ 16 $8,285
(a) The Non-Strategic Assets Portfolio business segment does not have any goodwill allocated to it.
(b) Includes goodwill related to BlackRock and GIS prior to the sale of GIS on July 1, 2010. See Note 2 Acquisition and Divestiture Activity for additional information regarding our
July 1, 2010 sale of GIS.
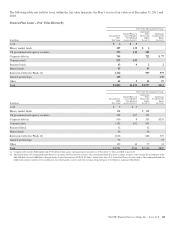
Changes in goodwill and other intangible assets during 2011
follow:
Summary of Changes in Goodwill and Other Intangible
Assets
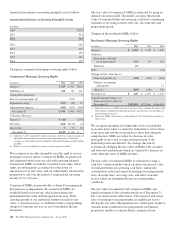
In millions Goodwill
Customer-
Related
Servicing
Rights
December 31, 2010 $8,149 $903 $1,701
Additions/adjustments:
BankAtlantic branch acquisition 41 1
Flagstar branch acquisition 17 1
Other (a) 78
Mortgage and other loan servicing
rights (266)
Impairment charge (157)
Amortization (163) (161)
December 31, 2011 $8,285 $742 $1,117
(a) Primarily related to correction of amounts for an acquisition affecting prior periods.
Assets and liabilities of acquired entities are recorded at
estimated fair value as of the acquisition date.
We conduct a goodwill impairment test on our reporting units
at least annually or more frequently if any adverse triggering
events occur. Based on the results of our analysis, there were
no impairment charges related to goodwill recognized in 2011,
2010 or 2009. The fair value of our reporting units is
determined by using discounted cash flow and market
comparability methodologies.
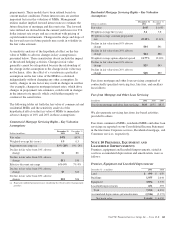
The gross carrying amount, accumulated amortization and net
carrying amount of other intangible assets by major category
consisted of the following:
Other Intangible Assets
In millions
December 31
2011
December 31
2010
Customer-related and other intangibles
Gross carrying amount $1,525 $1,524
Accumulated amortization (783) (621)
Net carrying amount $ 742 $ 903
Mortgage and other loan servicing rights
Gross carrying amount $2,009 $2,293
Valuation allowance (197) (40)
Accumulated amortization (695) (552)
Net carrying amount $1,117 $1,701
Total $1,859 $2,604
While certain of our other intangible assets have finite lives
and are amortized primarily on a straight-line basis, certain
core deposit intangibles are amortized on an accelerated basis.
For customer-related and other intangibles, the estimated
remaining useful lives range from 1 year to 10 years, with a
weighted-average remaining useful life of 8 years.
The PNC Financial Services Group, Inc. – Form 10-K 159