PNC Bank 2011 Annual Report Download - page 166
Download and view the complete annual report
Please find page 166 of the 2011 PNC Bank annual report below. You can navigate through the pages in the report by either clicking on the pages listed below, or by using the keyword search tool below to find specific information within the annual report.-
 1
1 -
2
-
3
-
4
-
5
-
6
-
7
-
8
-
9
-
10
-
11
-
12
-
13
-
14
-
15
-
16
-
17
-
18
-
19
-
20
-
21
-
22
-
23
-
24
-
25
-
26
-
27
-
28
-
29
-
30
-
31
-
32
-
33
-
34
-
35
-
36
-
37
-
38
-
39
-
40
-
41
-
42
-
43
-
44
-
45
-
46
-
47
-
48
-
49
-
50
-
51
-
52
-
53
-
54
-
55
-
56
-
57
-
58
-
59
-
60
-
61
-
62
-
63
-
64
-
65
-
66
-
67
-
68
-
69
-
70
-
71
-
72
-
73
-
74
-
75
-
76
-
77
-
78
-
79
-
80
-
81
-
82
-
83
-
84
-
85
-
86
-
87
-
88
-
89
-
90
-
91
-
92
-
93
-
94
-
95
-
96
-
97
-
98
-
99
-
100
-
101
-
102
-
103
-
104
-
105
-
106
-
107
-
108
-
109
-
110
-
111
-
112
-
113
-
114
-
115
-
116
-
117
-
118
-
119
-
120
-
121
-
122
-
123
-
124
-
125
-
126
-
127
-
128
-
129
-
130
-
131
-
132
-
133
-
134
-
135
-
136
-
137
-
138
-
139
-
140
-
141
-
142
-
143
-
144
-
145
-
146
-
147
-
148
-
149
-
150
-
151
-
152
-
153
-
154
-
155
-
 156
156 -
 157
157 -
 158
158 -
 159
159 -
 160
160 -
 161
161 -
 162
162 -
 163
163 -
 164
164 -
 165
165 -
 166
166 -
 167
167 -
 168
168 -
 169
169 -
 170
170 -
 171
171 -
 172
172 -
 173
173 -
 174
174 -
 175
175 -
 176
176 -
177
-
178
-
179
-
180
-
181
-
182
-
183
-
184
-
185
-
186
-
187
-
188
-
189
-
190
-
191
-
192
-
193
-
194
-
195
-
196
-
197
-
198
-
199
-
200
-
201
-
202
-
203
-
204
-
205
-
206
-
207
-
208
-
209
-
210
-
211
-
212
-
213
-
214
-
215
-
216
-
217
-
218
-
219
-
220
-
221
-
222
-
223
-
224
-
225
-
226
-
227
-
228
-
229
-
230
-
231
-
232
-
233
-
234
-
235
-
236
-
237
-
238
 |
 |
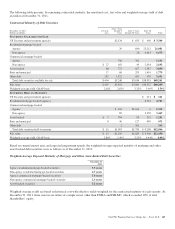
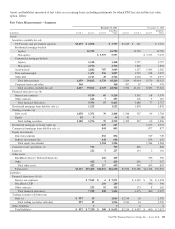
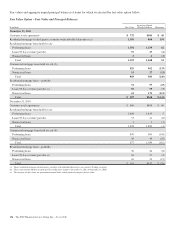
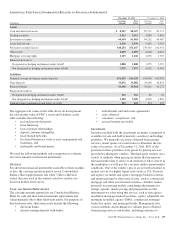
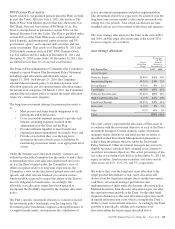
A
DDITIONAL
F
AIR
V
ALUE
I
NFORMATION
R
ELATED TO
F
INANCIAL
I
NSTRUMENTS
December 31, 2011 December 31, 2010
In millions
Carrying
Amount
Fair
Value
Carrying
Amount
Fair
Value
Assets
Cash and short-term assets $ 8,567 $8,567 $9,711 $9,711
Trading securities 2,513 2,513 1,826 1,826
Investment securities 60,634 61,018 64,262 64,487
Loans held for sale 2,936 2,939 3,492 3,492
Net loans (excludes leases) 148,254 151,167 139,316 141,431
Other assets 4,019 4,019 4,664 4,664
Mortgage servicing rights 1,115 1,118 1,698 1,707
Financial derivatives
Designated as hedging instruments under GAAP 1,888 1,888 1,255 1,255
Not designated as hedging instruments under GAAP 7,575 7,575 4,502 4,502
Liabilities
Demand, savings and money market deposits 156,335 156,335 141,990 141,990
Time deposits 31,632 31,882 41,400 41,825
Borrowed funds 36,966 39,064 39,821 41,273
Financial derivatives
Designated as hedging instruments under GAAP 116 116 85 85
Not designated as hedging instruments under GAAP 7,490 7,490 4,850 4,850
Unfunded loan commitments and letters of credit 223 223 173 173
The aggregate fair values in the table above do not represent
the total market value of PNC’s assets and liabilities as the
table excludes the following:
• real and personal property,
• lease financing,
• loan customer relationships,
• deposit customer intangibles,
• retail branch networks,
• fee-based businesses, such as asset management and
brokerage, and
• trademarks and brand names.
We used the following methods and assumptions to estimate
fair value amounts for financial instruments.
G
ENERAL
For short-term financial instruments realizable in three months
or less, the carrying amount reported on our Consolidated
Balance Sheet approximates fair value. Unless otherwise
stated, the rates used in discounted cash flow analyses are
based on market yield curves.
C
ASH AND
S
HORT
-T
ERM
A
SSETS
The carrying amounts reported on our Consolidated Balance
Sheet for cash and short-term investments approximate fair
values primarily due to their short-term nature. For purposes of
this disclosure only, short-term assets include the following:
• due from banks,
• interest-earning deposits with banks,
• federal funds sold and resale agreements,
• cash collateral,
• customers’ acceptances, and
• accrued interest receivable.
S
ECURITIES
Securities include both the investment securities (comprised of
available for sale and held to maturity securities) and trading
portfolios. We primarily use prices obtained from pricing
services, dealer quotes or recent trades to determine the fair
value of securities. As of December 31, 2011, 88% of the
positions in these portfolios were priced by pricing services
provided by third-party vendors. The third-party vendors use a
variety of methods when pricing securities that incorporate
relevant market data to arrive at an estimate of what a buyer in
the marketplace would pay for a security under current market
conditions. One of the vendor’s prices are set with reference to
market activity for highly liquid assets such as U.S. Treasury
and agency securities and agency mortgage-backed securities,
and matrix pricing for other asset classes, such as commercial
mortgage and other asset-backed securities. Another vendor
primarily uses pricing models considering adjustments for
ratings, spreads, matrix pricing and prepayments for the
instruments we value using this service, such as non-agency
residential mortgage-backed securities, agency adjustable rate
mortgage securities, agency CMOs, commercial mortgage-
backed securities, and municipal bonds. Management uses
various methods and techniques to validate prices obtained
from pricing services and dealers, including reference to
The PNC Financial Services Group, Inc. – Form 10-K 157