PNC Bank 2011 Annual Report Download - page 180
Download and view the complete annual report
Please find page 180 of the 2011 PNC Bank annual report below. You can navigate through the pages in the report by either clicking on the pages listed below, or by using the keyword search tool below to find specific information within the annual report.-
 1
1 -
2
-
3
-
4
-
5
-
6
-
7
-
8
-
9
-
10
-
11
-
12
-
13
-
14
-
15
-
16
-
17
-
18
-
19
-
20
-
21
-
22
-
23
-
24
-
25
-
26
-
27
-
28
-
29
-
30
-
31
-
32
-
33
-
34
-
35
-
36
-
37
-
38
-
39
-
40
-
41
-
42
-
43
-
44
-
45
-
46
-
47
-
48
-
49
-
50
-
51
-
52
-
53
-
54
-
55
-
56
-
57
-
58
-
59
-
60
-
61
-
62
-
63
-
64
-
65
-
66
-
67
-
68
-
69
-
70
-
71
-
72
-
73
-
74
-
75
-
76
-
77
-
78
-
79
-
80
-
81
-
82
-
83
-
84
-
85
-
86
-
87
-
88
-
89
-
90
-
91
-
92
-
93
-
94
-
95
-
96
-
97
-
98
-
99
-
100
-
101
-
102
-
103
-
104
-
105
-
106
-
107
-
108
-
109
-
110
-
111
-
112
-
113
-
114
-
115
-
116
-
117
-
118
-
119
-
120
-
121
-
122
-
123
-
124
-
125
-
126
-
127
-
128
-
129
-
130
-
131
-
132
-
133
-
134
-
135
-
136
-
137
-
138
-
139
-
140
-
141
-
142
-
143
-
144
-
145
-
146
-
147
-
148
-
149
-
150
-
151
-
152
-
153
-
154
-
155
-
156
-
157
-
158
-
159
-
160
-
161
-
162
-
163
-
164
-
165
-
166
-
167
-
168
-
169
-
 170
170 -
 171
171 -
 172
172 -
 173
173 -
 174
174 -
 175
175 -
 176
176 -
 177
177 -
 178
178 -
 179
179 -
 180
180 -
 181
181 -
 182
182 -
 183
183 -
 184
184 -
 185
185 -
 186
186 -
 187
187 -
 188
188 -
 189
189 -
 190
190 -
191
-
192
-
193
-
194
-
195
-
196
-
197
-
198
-
199
-
200
-
201
-
202
-
203
-
204
-
205
-
206
-
207
-
208
-
209
-
210
-
211
-
212
-
213
-
214
-
215
-
216
-
217
-
218
-
219
-
220
-
221
-
222
-
223
-
224
-
225
-
226
-
227
-
228
-
229
-
230
-
231
-
232
-
233
-
234
-
235
-
236
-
237
-
238
 |
 |

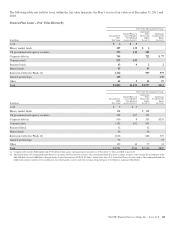
The components of net periodic benefit cost/(income) and other amounts recognized in other comprehensive income were as
follows.
Components of Net Periodic Benefit Cost
Qualified Pension Plan Nonqualified Pension Plan Postretirement Benefits
Year ended December 31 – in millions 2011 2010 2009 2011 2010 2009 2011 2010 2009
Net periodic cost consists of:
Service cost $94 $ 102 $ 90 $4 $3 $2 $7 $5 $4
Interest cost 196 203 206 13 14 15 19 20 21
Expected return on plan assets (298) (285) (260)
Amortization of prior service cost (8) (8) (2) (3) (3) (5)
Amortization of actuarial losses 19 34 83 531
Net periodic cost 346 117 22 20 18 23 22 20
Other changes in plan assets and benefit obligations recognized in other
comprehensive income:
Current year prior service cost/(credit) (43) 2
Amortization of prior service credit 882 335
Current year actuarial loss/(gain) 579 (99) (263) 15 11 24 (1) 21 21
Amortization of actuarial (loss) (19) (34) (83) (5) (3) (1) (1)
Total recognized in OCI 568 (125) (387) 10 825 124 26
Total recognized in net periodic cost and OCI $ 571 $ (79) $(270) $32 $28 $43 $24 $46 $46
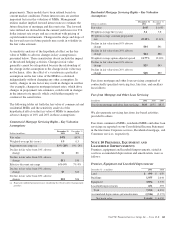
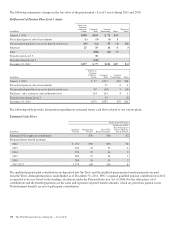
The weighted-average assumptions used (as of the beginning
of each year) to determine net periodic costs shown above
were as follows:
Net Periodic Costs – Assumptions
Net Periodic Cost Determination
Year ended December 31 2011 2010 2009
Discount rate
Qualified pension 5.20% 5.75% 6.05%
Nonqualified pension 4.80 5.15 5.90
Postretirement benefits 5.00 5.40 5.95
Rate of compensation increase (average) 4.00 4.00 4.00
Assumed health care cost trend rate
Initial trend 8.00 8.50 9.00
Ultimate trend 5.00 5.00 5.00
Year ultimate reached 2019 2014 2014
Expected long-term return on plan assets 7.75 8.00 8.25
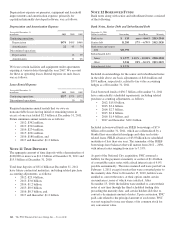
The weighted-average assumptions used (as of the end of each
year) to determine year-end obligations for pension and
postretirement benefits were as follows:
Other Pension Assumptions
At December 31
Year ended December 31 2011 2010
Discount rate
Qualified pension 4.60% 5.20%
Nonqualified pension 4.20 4.80
Postretirement benefits 4.40 5.00
Rate of compensation increase (average) 4.00 4.00
Assumed health care cost trend rate
Initial trend 8.00 8.00
Ultimate trend 5.00 5.00
Year ultimate reached 2019 2019
The discount rates are determined independently for each plan by
comparing the expected future benefits that will be paid under each
plan with yields available on high quality corporate bonds of similar
duration. For this analysis, 10% of bonds with the highest yields and
40% with the lowest yields were removed from the bond universe.
The expected return on plan assets is a long-term assumption
established by considering historical and anticipated returns of
the asset classes invested in by the pension plan and the
allocation strategy currently in place among those classes. We
review this assumption at each measurement date and adjust it
if warranted. This assumption remains at 7.75% for
determining 2012 net periodic cost.
The PNC Financial Services Group, Inc. – Form 10-K 171