PNC Bank 2011 Annual Report Download - page 77
Download and view the complete annual report
Please find page 77 of the 2011 PNC Bank annual report below. You can navigate through the pages in the report by either clicking on the pages listed below, or by using the keyword search tool below to find specific information within the annual report.-
 1
1 -
2
-
3
-
4
-
5
-
6
-
7
-
8
-
9
-
10
-
11
-
12
-
13
-
14
-
15
-
16
-
17
-
18
-
19
-
20
-
21
-
22
-
23
-
24
-
25
-
26
-
27
-
28
-
29
-
30
-
31
-
32
-
33
-
34
-
35
-
36
-
37
-
38
-
39
-
40
-
41
-
42
-
43
-
44
-
45
-
46
-
47
-
48
-
49
-
50
-
51
-
52
-
53
-
54
-
55
-
56
-
57
-
58
-
59
-
60
-
61
-
62
-
63
-
64
-
65
-
66
-
 67
67 -
 68
68 -
 69
69 -
 70
70 -
 71
71 -
 72
72 -
 73
73 -
 74
74 -
 75
75 -
 76
76 -
 77
77 -
 78
78 -
 79
79 -
 80
80 -
 81
81 -
 82
82 -
 83
83 -
 84
84 -
 85
85 -
 86
86 -
 87
87 -
88
-
89
-
90
-
91
-
92
-
93
-
94
-
95
-
96
-
97
-
98
-
99
-
100
-
101
-
102
-
103
-
104
-
105
-
106
-
107
-
108
-
109
-
110
-
111
-
112
-
113
-
114
-
115
-
116
-
117
-
118
-
119
-
120
-
121
-
122
-
123
-
124
-
125
-
126
-
127
-
128
-
129
-
130
-
131
-
132
-
133
-
134
-
135
-
136
-
137
-
138
-
139
-
140
-
141
-
142
-
143
-
144
-
145
-
146
-
147
-
148
-
149
-
150
-
151
-
152
-
153
-
154
-
155
-
156
-
157
-
158
-
159
-
160
-
161
-
162
-
163
-
164
-
165
-
166
-
167
-
168
-
169
-
170
-
171
-
172
-
173
-
174
-
175
-
176
-
177
-
178
-
179
-
180
-
181
-
182
-
183
-
184
-
185
-
186
-
187
-
188
-
189
-
190
-
191
-
192
-
193
-
194
-
195
-
196
-
197
-
198
-
199
-
200
-
201
-
202
-
203
-
204
-
205
-
206
-
207
-
208
-
209
-
210
-
211
-
212
-
213
-
214
-
215
-
216
-
217
-
218
-
219
-
220
-
221
-
222
-
223
-
224
-
225
-
226
-
227
-
228
-
229
-
230
-
231
-
232
-
233
-
234
-
235
-
236
-
237
-
238
 |
 |
S
TATUS
O
F
Q
UALIFIED
D
EFINED
B
ENEFIT
P
ENSION
P
LAN
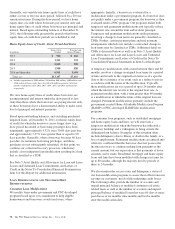
We have a noncontributory, qualified defined benefit pension
plan (plan or pension plan) covering eligible employees.
Benefits are determined using a cash balance formula where
earnings credits are a percentage of eligible compensation.
Pension contributions are based on an actuarially determined
amount necessary to fund total benefits payable to plan
participants. Consistent with our investment strategy, plan
assets are primarily invested in equity investments and fixed
income instruments. Plan fiduciaries determine and review the
plan’s investment policy, which is described more fully in
Note 14 Employee Benefit Plans in the Notes To Consolidated
Financial Statements in Item 8 of this Report.
We calculate the expense associated with the pension plan and
the assumptions and methods that we use include a policy of
reflecting trust assets at their fair market value. On an annual
basis, we review the actuarial assumptions related to the
pension plan. The primary assumptions used to measure
pension obligations and costs are the discount rate,
compensation increase and expected long-term return on
assets. Among these, the compensation increase assumption
does not significantly affect pension expense.
The discount rate used to measure pension obligations is
determined by comparing the expected future benefits that
will be paid under the plan with yields available on high
quality corporate bonds of similar duration. In lower interest
rate environments, the sensitivity of pension expense to the
assumed discount rate increases. The impact on pension
expense of a 0.5% decrease in discount rate in the current
environment is $23 million per year. In contrast, the
sensitivity to the same change in discount rate in a higher
interest rate environment is less significant.
The expected long-term return on assets assumption also has a
significant effect on pension expense. The expected return on
plan assets is a long-term assumption established by
considering historical and anticipated returns of the asset
classes invested in by the pension plan and the asset allocation
policy currently in place. For purposes of setting and
reviewing this assumption, “long term” refers to the period
over which the plan’s projected benefit obligations will be
disbursed. We review this assumption at each measurement
date and adjust it if warranted. Our selection process
references certain historical data and the current environment,
but primarily utilizes qualitative judgment regarding future
return expectations. Accordingly, we generally do not change
the assumption unless we modify our investment strategy or
identify events that would alter our expectations of future
returns.
To evaluate the continued reasonableness of our assumption,
we examine a variety of viewpoints and data. Various studies
have shown that portfolios comprised primarily of US equity
securities have historically returned approximately 10%
annually over long periods of time, while US debt securities
have returned approximately 6% annually over long periods.
Application of these historical returns to the plan’s allocation
ranges for equities and bonds produces a result between 7.25%
and 8.75% and is one point of reference, among many other
factors, that is taken into consideration. We also examine the
plan’s actual historical returns over various periods. Recent
experience is considered in our evaluation with appropriate
consideration that, especially for short time periods, recent
returns are not reliable indicators of future returns. While
annual returns can vary significantly (rates of return for 2011,
2010, and 2009 were +.11%, +14.87%, and +20.61%,
respectively), the selected assumption represents our estimated
long-term average prospective returns.
Acknowledging the potentially wide range for this
assumption, we also annually examine the assumption used by
other companies with similar pension investment strategies, so
that we can ascertain whether our determinations markedly
differ from others. In all cases, however, this data simply
informs our process, which places the greatest emphasis on
our qualitative judgment of future investment returns, given
the conditions existing at each annual measurement date.
Taking into consideration all of these factors, the expected
long-term return on plan assets for determining net periodic
pension cost for 2011 was 7.75%, down from 8.00% for 2010.
This reduction was made after considering the views of both
internal and external capital market advisors, particularly with
regard to the effects of the recent economic environment on
long-term prospective fixed income returns. We are
maintaining our expected long-term return on assets at 7.75%
for determining pension cost for 2012.
Under current accounting rules, the difference between
expected long-term returns and actual returns is accumulated
and amortized to pension expense over future periods. Each
one percentage point difference in actual return compared
with our expected return causes expense in subsequent years
to increase or decrease by up to $8 million as the impact is
amortized into results of operations.
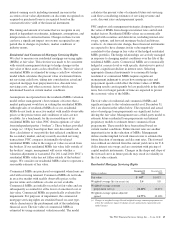
We currently estimate a pretax pension expense of $93 million
in 2012 compared with pretax expense of $3 million in 2011.
This year-over-year expected increase is primarily due to the
amortization impact of the unfavorable 2011 investment
returns as compared with the expected long-term return
assumption and the increase in obligations due to the drop in
the discount rate. In addition, the estimate for 2012 includes
approximately $2 million for employees expected to join the
plan after the RBC Bank (USA) acquisition.
68 The PNC Financial Services Group, Inc. – Form 10-K