PNC Bank 2011 Annual Report Download - page 84
Download and view the complete annual report
Please find page 84 of the 2011 PNC Bank annual report below. You can navigate through the pages in the report by either clicking on the pages listed below, or by using the keyword search tool below to find specific information within the annual report.-
 1
1 -
2
-
3
-
4
-
5
-
6
-
7
-
8
-
9
-
10
-
11
-
12
-
13
-
14
-
15
-
16
-
17
-
18
-
19
-
20
-
21
-
22
-
23
-
24
-
25
-
26
-
27
-
28
-
29
-
30
-
31
-
32
-
33
-
34
-
35
-
36
-
37
-
38
-
39
-
40
-
41
-
42
-
43
-
44
-
45
-
46
-
47
-
48
-
49
-
50
-
51
-
52
-
53
-
54
-
55
-
56
-
57
-
58
-
59
-
60
-
61
-
62
-
63
-
64
-
65
-
66
-
67
-
68
-
69
-
70
-
71
-
72
-
73
-
 74
74 -
 75
75 -
 76
76 -
 77
77 -
 78
78 -
 79
79 -
 80
80 -
 81
81 -
 82
82 -
 83
83 -
 84
84 -
 85
85 -
 86
86 -
 87
87 -
 88
88 -
 89
89 -
 90
90 -
 91
91 -
 92
92 -
 93
93 -
 94
94 -
95
-
96
-
97
-
98
-
99
-
100
-
101
-
102
-
103
-
104
-
105
-
106
-
107
-
108
-
109
-
110
-
111
-
112
-
113
-
114
-
115
-
116
-
117
-
118
-
119
-
120
-
121
-
122
-
123
-
124
-
125
-
126
-
127
-
128
-
129
-
130
-
131
-
132
-
133
-
134
-
135
-
136
-
137
-
138
-
139
-
140
-
141
-
142
-
143
-
144
-
145
-
146
-
147
-
148
-
149
-
150
-
151
-
152
-
153
-
154
-
155
-
156
-
157
-
158
-
159
-
160
-
161
-
162
-
163
-
164
-
165
-
166
-
167
-
168
-
169
-
170
-
171
-
172
-
173
-
174
-
175
-
176
-
177
-
178
-
179
-
180
-
181
-
182
-
183
-
184
-
185
-
186
-
187
-
188
-
189
-
190
-
191
-
192
-
193
-
194
-
195
-
196
-
197
-
198
-
199
-
200
-
201
-
202
-
203
-
204
-
205
-
206
-
207
-
208
-
209
-
210
-
211
-
212
-
213
-
214
-
215
-
216
-
217
-
218
-
219
-
220
-
221
-
222
-
223
-
224
-
225
-
226
-
227
-
228
-
229
-
230
-
231
-
232
-
233
-
234
-
235
-
236
-
237
-
238
 |
 |
(d) Effective in the second quarter 2011, the commercial nonaccrual policy was applied
to certain small business credit card balances. This change resulted in loans being
placed on nonaccrual status when they become 90 days or more past due. We
continue to charge off these loans at 180 days past due.
(e) Nonperforming loans do not include government insured or guaranteed loans, loans
held for sale, loans accounted for under the fair value option and purchased impaired
loans.
(f) Other real estate owned excludes $280 million and $178 million at December 31,
2011 and December 31, 2010, respectively, related to residential real estate that was
acquired by us upon foreclosure of serviced loans because they are insured by the
Federal Housing Administration (FHA) or guaranteed by the Department of
Veterans Affairs (VA).
(g) The allowance for loan and lease losses includes impairment reserves attributable to
purchased impaired loans. See Note 5 Asset Quality and Allowances for Loan and
Lease Losses and Unfunded Loan Commitments and Letters of Credit in the Notes
To Consolidated Financial Statements in Item 8 of this Report for additional
information.
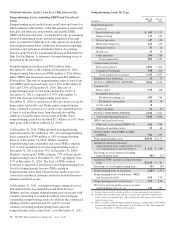
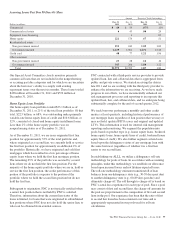
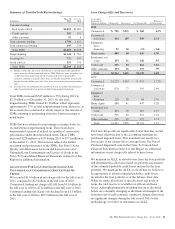
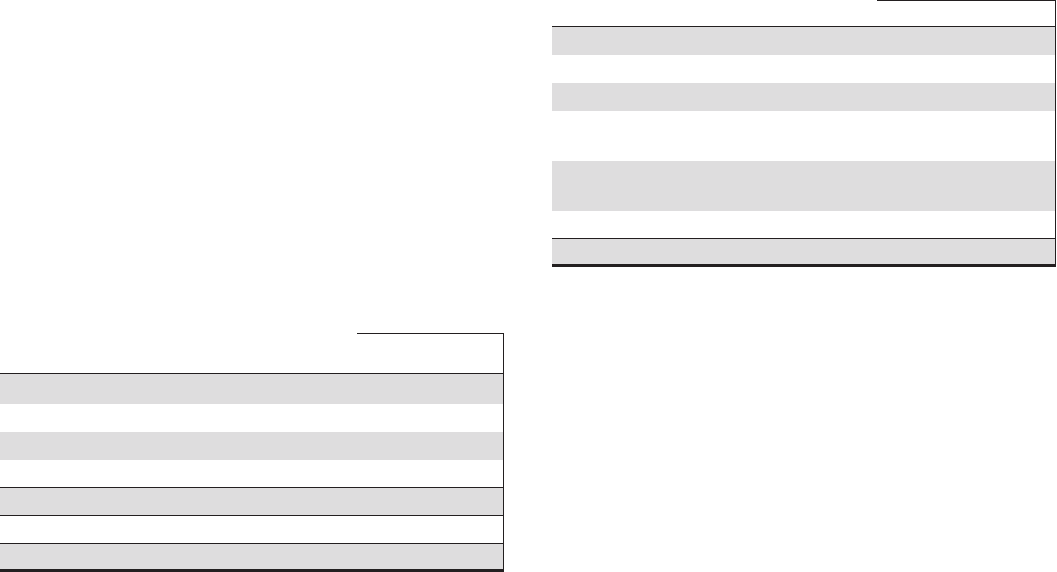
OREO and Foreclosed Assets
In millions
Dec. 31
2011
Dec. 31
2010
Other real estate owned (OREO):
Residential properties $191 $304
Residential development properties 183 166
Commercial properties 187 119
Total OREO 561 589
Foreclosed and other assets 35 68
OREO and foreclosed assets $596 $657
Total OREO and foreclosed assets decreased $61 million
during 2011 from $657 million at December 31, 2010, to $596
million at December 31, 2011, which represents 14% of total
nonperforming assets. As of December 31, 2011 and
December 31, 2010, 32% and 46%, respectively, of our
OREO and foreclosed assets were comprised of single family
residential properties. The lower level of OREO and
foreclosed assets was driven by lower levels of residential
properties as new foreclosures have fallen from the very high
levels of early 2010 and sales of foreclosed properties have
rebounded from the low point in the fourth quarter 2010,
partially offset by an increase in commercial properties which
was due to an increase in the average balance added to OREO
with commercial property sales remaining constant year over
year. Excluded from OREO at December 31, 2011 and
December 31, 2010, respectively, was $280 million and $178
million of residential real estate that was acquired by us upon
foreclosure of serviced loans because they are insured by the
Federal Housing Administration (FHA) or guaranteed by the
Department of Veterans Affairs (VA).
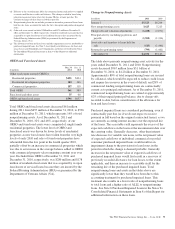
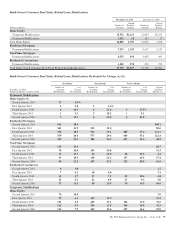
Change in Nonperforming Assets
In millions 2011 2010
January 1 $5,123 $6,204
New nonperforming assets 3,625 5,213
Charge-offs and valuation adjustments (1,220) (2,071)
Principal activity, including paydowns and
payoffs (1,960) (1,316)
Asset sales and transfers to loans held for
sale (613) (1,446)
Returned to performing status (799) (1,461)
December 31 $4,156 $5,123
The table above presents nonperforming asset activity for the
years ended December 31, 2011 and 2010. Nonperforming
assets decreased $967 million from $5.1 billion at
December 31, 2010, to $4.2 billion at December 31, 2011.
Approximately 80% of total nonperforming loans are secured
by collateral, which would be expected to reduce credit losses
and require less reserves in the event of default, and 28% of
commercial lending nonperforming loans are contractually
current as to principal and interest. As of December 31, 2011,
commercial nonperforming loans are carried at approximately
62% of their unpaid principal balance, due to charge-offs
recorded to date, before consideration of the allowance for
loan and lease losses.
Purchased impaired loans are considered performing, even if
contractually past due (or if we do not expect to receive
payment in full based on the original contractual terms), as we
are currently accreting interest income over the expected life
of the loans. The accretable yield represents the excess of the
expected cash flows on the loans at the measurement date over
the carrying value. Generally decreases, other than interest
rate decreases for variable rate notes, in the net present value
of expected cash flows of individual commercial or pooled
consumer purchased impaired loans would result in an
impairment charge to the provision for loan losses in the
period in which the change is deemed probable. Generally
increases in the net present value of expected cash flows of
purchased impaired loans would first result in a recovery of
previously recorded allowance for loan losses, to the extent
applicable, and then an increase to accretable yield for the
remaining life of the purchased impaired loans. Total
nonperforming loans and assets in the tables above are
significantly lower than they would have been due to this
accounting treatment for purchased impaired loans. This
treatment also results in a lower ratio of nonperforming loans
to total loans and a higher ratio of ALLL to nonperforming
loans. See Note 6 Purchased Impaired Loans in the Notes To
Consolidated Financial Statements in Item 8 of this Report for
additional information on these loans.
The PNC Financial Services Group, Inc. – Form 10-K 75