PNC Bank 2011 Annual Report Download - page 36
Download and view the complete annual report
Please find page 36 of the 2011 PNC Bank annual report below. You can navigate through the pages in the report by either clicking on the pages listed below, or by using the keyword search tool below to find specific information within the annual report.-
 1
1 -
2
-
3
-
4
-
5
-
6
-
7
-
8
-
9
-
10
-
11
-
12
-
13
-
14
-
15
-
16
-
17
-
18
-
19
-
20
-
21
-
22
-
23
-
24
-
25
-
 26
26 -
 27
27 -
 28
28 -
 29
29 -
 30
30 -
 31
31 -
 32
32 -
 33
33 -
 34
34 -
 35
35 -
 36
36 -
 37
37 -
 38
38 -
 39
39 -
 40
40 -
 41
41 -
 42
42 -
 43
43 -
 44
44 -
 45
45 -
 46
46 -
47
-
48
-
49
-
50
-
51
-
52
-
53
-
54
-
55
-
56
-
57
-
58
-
59
-
60
-
61
-
62
-
63
-
64
-
65
-
66
-
67
-
68
-
69
-
70
-
71
-
72
-
73
-
74
-
75
-
76
-
77
-
78
-
79
-
80
-
81
-
82
-
83
-
84
-
85
-
86
-
87
-
88
-
89
-
90
-
91
-
92
-
93
-
94
-
95
-
96
-
97
-
98
-
99
-
100
-
101
-
102
-
103
-
104
-
105
-
106
-
107
-
108
-
109
-
110
-
111
-
112
-
113
-
114
-
115
-
116
-
117
-
118
-
119
-
120
-
121
-
122
-
123
-
124
-
125
-
126
-
127
-
128
-
129
-
130
-
131
-
132
-
133
-
134
-
135
-
136
-
137
-
138
-
139
-
140
-
141
-
142
-
143
-
144
-
145
-
146
-
147
-
148
-
149
-
150
-
151
-
152
-
153
-
154
-
155
-
156
-
157
-
158
-
159
-
160
-
161
-
162
-
163
-
164
-
165
-
166
-
167
-
168
-
169
-
170
-
171
-
172
-
173
-
174
-
175
-
176
-
177
-
178
-
179
-
180
-
181
-
182
-
183
-
184
-
185
-
186
-
187
-
188
-
189
-
190
-
191
-
192
-
193
-
194
-
195
-
196
-
197
-
198
-
199
-
200
-
201
-
202
-
203
-
204
-
205
-
206
-
207
-
208
-
209
-
210
-
211
-
212
-
213
-
214
-
215
-
216
-
217
-
218
-
219
-
220
-
221
-
222
-
223
-
224
-
225
-
226
-
227
-
228
-
229
-
230
-
231
-
232
-
233
-
234
-
235
-
236
-
237
-
238
 |
 |

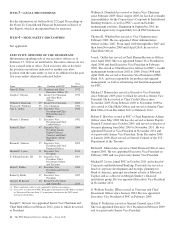
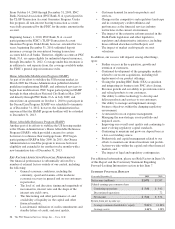
ITEM
6–
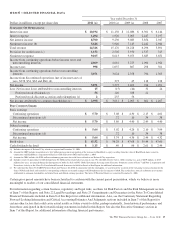
SELECTED FINANCIAL DATA
Year ended December 31
Dollars in millions, except per share data 2011 (a) 2010 (a) 2009 (a) 2008 2007
S
UMMARY
O
F
O
PERATIONS
Interest income $ 10,194 $ 11,150 $ 12,086 $ 6,301 $ 6,144
Interest expense 1,494 1,920 3,003 2,447 3,197
Net interest income 8,700 9,230 9,083 3,854 2,947
Noninterest income (b) 5,626 5,946 7,145 2,442 2,944
Total revenue 14,326 15,176 16,228 6,296 5,891
Provision for credit losses (c) 1,152 2,502 3,930 1,517 315
Noninterest expense 9,105 8,613 9,073 3,685 3,652
Income from continuing operations before income taxes and
noncontrolling interests 4,069 4,061 3,225 1,094 1,924
Income taxes 998 1,037 867 298 561
Income from continuing operations before noncontrolling
interests 3,071 3,024 2,358 796 1,363
Income from discontinued operations (net of income taxes of
zero, $338, $54, $63 and $66) (d) 373 45 118 128
Net income 3,071 3,397 2,403 914 1,491
Less: Net income (loss) attributable to noncontrolling interests 15 (15) (44) 32 24
Preferred stock dividends (e) 56 146 388 21
Preferred stock discount accretion and redemptions (e) 2255 56
Net income attributable to common shareholders (e) $ 2,998 $ 3,011 $ 2,003 $ 861 $ 1,467
P
ER
C
OMMON
S
HARE
Basic earnings
Continuing operations $ 5.70 $ 5.08 $ 4.30 $ 2.15 $ 4.02
Discontinued operations (d) .72 .10 .34 .38
Net income $ 5.70 $ 5.80 $ 4.40 $ 2.49 $ 4.40
Diluted earnings
Continuing operations $ 5.64 $ 5.02 $ 4.26 $ 2.10 $ 3.94
Discontinued operations (d) .72 .10 .34 .38
Net income $ 5.64 $ 5.74 $ 4.36 $ 2.44 $ 4.32
Book value $ 61.52 $ 56.29 $ 47.68 $ 39.44 $ 43.60
Cash dividends declared $ 1.15 $ .40 $ .96 $ 2.61 $ 2.44
(a) Includes the impact of National City, which we acquired on December 31, 2008.
(b) Amount for 2009 includes recognition of a $1.1 billion pretax gain on our portion of the increase in BlackRock’s equity resulting from the value of BlackRock shares issued in
connection with BlackRock’s acquisition of Barclays Global Investors (BGI) on December 1, 2009.
(c) Amount for 2008 includes the $504 million conforming provision for credit losses related to our National City acquisition.
(d) Includes results of operations for GIS through June 30, 2010 and the related after-tax gain on sale. We sold GIS effective July 1, 2010, resulting in a gain of $639 million, or $328
million after taxes, recognized during the third quarter of 2010. See Sale of PNC Global Investment Servicing in the Executive Summary section of Item 7 and Note 2 Acquisition and
Divestiture Activity in the Notes To Consolidated Financial Statements included in Item 8 of this Report for additional information.
(e) We redeemed the Series N (TARP) Preferred Stock on February 10, 2010. In connection with the redemption, we accelerated the accretion of the remaining issuance discount on the
Series N Preferred Stock and recorded a corresponding reduction in retained earnings of $250 million in the first quarter of 2010. This resulted in a noncash reduction in net income
attributable to common shareholders and related basic and diluted earnings per share. The Series N Preferred Stock was issued on December 31, 2008.
Certain prior period amounts have been reclassified to conform with the current period presentation, which we believe is more
meaningful to readers of our consolidated financial statements.
For information regarding certain business, regulatory and legal risks, see Item 1A Risk Factors and the Risk Management section
of Item 7 of this Report, and Note 22 Legal Proceedings and Note 23 Commitments and Guarantees in the Notes To Consolidated
Financial Statements included in Item 8 of this Report for additional information. Also, see the Cautionary Statement Regarding
Forward-Looking Information and Critical Accounting Estimates And Judgments sections included in Item 7 of this Report for
certain other factors that could cause actual results or future events to differ, perhaps materially, from historical performance and
from those anticipated in the forward-looking statements included in this Report. See also the Executive Summary section in
Item 7 of this Report for additional information affecting financial performance.
The PNC Financial Services Group, Inc. – Form 10-K 27