PNC Bank 2011 Annual Report Download - page 55
Download and view the complete annual report
Please find page 55 of the 2011 PNC Bank annual report below. You can navigate through the pages in the report by either clicking on the pages listed below, or by using the keyword search tool below to find specific information within the annual report.-
 1
1 -
2
-
3
-
4
-
5
-
6
-
7
-
8
-
9
-
10
-
11
-
12
-
13
-
14
-
15
-
16
-
17
-
18
-
19
-
20
-
21
-
22
-
23
-
24
-
25
-
26
-
27
-
28
-
29
-
30
-
31
-
32
-
33
-
34
-
35
-
36
-
37
-
38
-
39
-
40
-
41
-
42
-
43
-
44
-
 45
45 -
 46
46 -
 47
47 -
 48
48 -
 49
49 -
 50
50 -
 51
51 -
 52
52 -
 53
53 -
 54
54 -
 55
55 -
 56
56 -
 57
57 -
 58
58 -
 59
59 -
 60
60 -
 61
61 -
 62
62 -
 63
63 -
 64
64 -
 65
65 -
66
-
67
-
68
-
69
-
70
-
71
-
72
-
73
-
74
-
75
-
76
-
77
-
78
-
79
-
80
-
81
-
82
-
83
-
84
-
85
-
86
-
87
-
88
-
89
-
90
-
91
-
92
-
93
-
94
-
95
-
96
-
97
-
98
-
99
-
100
-
101
-
102
-
103
-
104
-
105
-
106
-
107
-
108
-
109
-
110
-
111
-
112
-
113
-
114
-
115
-
116
-
117
-
118
-
119
-
120
-
121
-
122
-
123
-
124
-
125
-
126
-
127
-
128
-
129
-
130
-
131
-
132
-
133
-
134
-
135
-
136
-
137
-
138
-
139
-
140
-
141
-
142
-
143
-
144
-
145
-
146
-
147
-
148
-
149
-
150
-
151
-
152
-
153
-
154
-
155
-
156
-
157
-
158
-
159
-
160
-
161
-
162
-
163
-
164
-
165
-
166
-
167
-
168
-
169
-
170
-
171
-
172
-
173
-
174
-
175
-
176
-
177
-
178
-
179
-
180
-
181
-
182
-
183
-
184
-
185
-
186
-
187
-
188
-
189
-
190
-
191
-
192
-
193
-
194
-
195
-
196
-
197
-
198
-
199
-
200
-
201
-
202
-
203
-
204
-
205
-
206
-
207
-
208
-
209
-
210
-
211
-
212
-
213
-
214
-
215
-
216
-
217
-
218
-
219
-
220
-
221
-
222
-
223
-
224
-
225
-
226
-
227
-
228
-
229
-
230
-
231
-
232
-
233
-
234
-
235
-
236
-
237
-
238
 |
 |

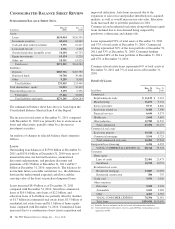
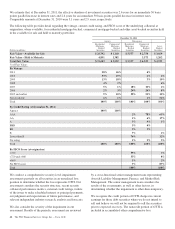
We manage our capital position by making adjustments to our
balance sheet size and composition, issuing debt, equity or
hybrid instruments, executing treasury stock transactions,
managing dividend policies and retaining earnings.
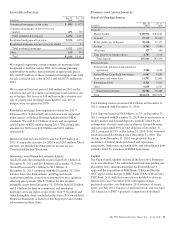
Total shareholders’ equity increased $3.8 billion, to $34.1
billion, at December 31, 2011 compared with December 31,
2010 as retained earnings increased $2.4 billion. The issuance
of $1.0 billion of preferred stock in July 2011 contributed to
the increase in capital surplus – preferred stock from $.6
billion at December 31, 2010 to $1.6 billion at December 31,
2011. Accumulated other comprehensive loss decreased to a
loss of $.1 billion, at December 31, 2011 compared with a loss
of $.4 billion at December 31, 2010 due to net unrealized
gains on securities and cash flow hedge derivatives, offset by
an increase in accumulated other comprehensive losses related
to the change in the funded status of our pension and other
postretirement benefit plans. Common shares outstanding
were 527 million at December 31, 2011 and 526 million at
December 31, 2010.
Our current common stock repurchase program permits us to
purchase up to 25 million shares of PNC common stock on the
open market or in privately negotiated transactions. This
program will remain in effect until fully utilized or until
modified, superseded or terminated. The extent and timing of
share repurchases under this program will depend on a number
of factors including, among others, market and general
economic conditions, economic and regulatory capital
considerations, alternative uses of capital, the potential impact
on our credit ratings, and regulatory and contractual
limitations. We did not purchase any shares in 2011 under this
program. See “Supervision and Regulation” in Item 1 of this
Report for further information concerning restrictions on
dividends and stock repurchases, including the impact of the
Federal Reserve’s current supervisory assessment of capital
adequacy program which is also discussed in the Capital and
Liquidity portion of the Executive Summary section of this
Item 7.
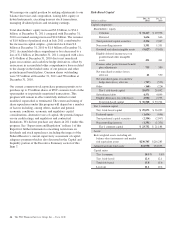
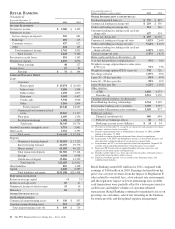
Risk-Based Capital
Dollars in millions
Dec. 31
2011
Dec. 31
2010
Capital components
Shareholders’ equity
Common $ 32,417 $ 29,596
Preferred 1,636 646
Trust preferred capital securities 2,354 2,907
Noncontrolling interests 1,351 1,351
Goodwill and other intangible assets (9,027) (9,053)
Eligible deferred income taxes on
goodwill and other intangible
assets 431 461
Pension, other postretirement benefit
plan adjustments 755 380
Net unrealized securities losses,
after-tax 41 550
Net unrealized gains on cash flow
hedge derivatives, after-tax (717) (522)
Other (168) (224)
Tier 1 risk-based capital 29,073 26,092
Subordinated debt 4,571 4,899
Eligible allowance for credit losses 2,904 2,733
Total risk-based capital $ 36,548 $ 33,724
Tier 1 common capital
Tier 1 risk-based capital $ 29,073 $ 26,092
Preferred equity (1,636) (646)
Trust preferred capital securities (2,354) (2,907)
Noncontrolling interests (1,351) (1,351)
Tier 1 common capital $ 23,732 $ 21,188
Assets
Risk-weighted assets, including off-
balance sheet instruments and market
risk equivalent assets $230,705 $216,283
Adjusted average total assets 261,958 254,693
Capital ratios
Tier 1 common 10.3% 9.8%
Tier 1 risk-based 12.6 12.1
Total risk-based 15.8 15.6
Leverage 11.1 10.2
46 The PNC Financial Services Group, Inc. – Form 10-K