PNC Bank 2011 Annual Report Download - page 5
Download and view the complete annual report
Please find page 5 of the 2011 PNC Bank annual report below. You can navigate through the pages in the report by either clicking on the pages listed below, or by using the keyword search tool below to find specific information within the annual report.-
 1
1 -
 2
2 -
 3
3 -
 4
4 -
 5
5 -
 6
6 -
 7
7 -
 8
8 -
 9
9 -
 10
10 -
 11
11 -
 12
12 -
 13
13 -
 14
14 -
 15
15 -
 16
16 -
17
-
18
-
19
-
20
-
21
-
22
-
23
-
24
-
25
-
26
-
27
-
28
-
29
-
30
-
31
-
32
-
33
-
34
-
35
-
36
-
37
-
38
-
39
-
40
-
41
-
42
-
43
-
44
-
45
-
46
-
47
-
48
-
49
-
50
-
51
-
52
-
53
-
54
-
55
-
56
-
57
-
58
-
59
-
60
-
61
-
62
-
63
-
64
-
65
-
66
-
67
-
68
-
69
-
70
-
71
-
72
-
73
-
74
-
75
-
76
-
77
-
78
-
79
-
80
-
81
-
82
-
83
-
84
-
85
-
86
-
87
-
88
-
89
-
90
-
91
-
92
-
93
-
94
-
95
-
96
-
97
-
98
-
99
-
100
-
101
-
102
-
103
-
104
-
105
-
106
-
107
-
108
-
109
-
110
-
111
-
112
-
113
-
114
-
115
-
116
-
117
-
118
-
119
-
120
-
121
-
122
-
123
-
124
-
125
-
126
-
127
-
128
-
129
-
130
-
131
-
132
-
133
-
134
-
135
-
136
-
137
-
138
-
139
-
140
-
141
-
142
-
143
-
144
-
145
-
146
-
147
-
148
-
149
-
150
-
151
-
152
-
153
-
154
-
155
-
156
-
157
-
158
-
159
-
160
-
161
-
162
-
163
-
164
-
165
-
166
-
167
-
168
-
169
-
170
-
171
-
172
-
173
-
174
-
175
-
176
-
177
-
178
-
179
-
180
-
181
-
182
-
183
-
184
-
185
-
186
-
187
-
188
-
189
-
190
-
191
-
192
-
193
-
194
-
195
-
196
-
197
-
198
-
199
-
200
-
201
-
202
-
203
-
204
-
205
-
206
-
207
-
208
-
209
-
210
-
211
-
212
-
213
-
214
-
215
-
216
-
217
-
218
-
219
-
220
-
221
-
222
-
223
-
224
-
225
-
226
-
227
-
228
-
229
-
230
-
231
-
232
-
233
-
234
-
235
-
236
-
237
-
238
 |
 |

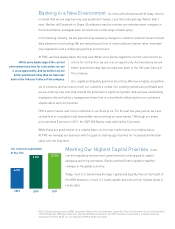
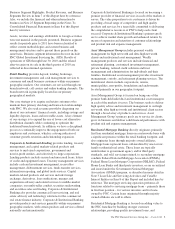
Serving More Customers We had an exceptional year for customer growth in
2011. In our Retail Bank, checking relationships increased by almost 300,000, including some
40,000 from acquisitions. That represents 5 percent growth, which substantially surpassed the
1 percent population increase in our footprint, demonstrating that PNC is winning market share.
We believe some of this growth was driven by disruption in the marketplace. Checking accounts,
while traditionally profitable, have come under intense pressure as an extended period of low
interest rates and regulatory changes eroded their value.
Some of our competitors responded by adding incremental fees to existing products, and many
banks eliminated free checking. PNC took a different path.
We chose to offer our customers more in return for their business. In March of 2011, we
introduced a new suite of checking products designed to provide more choices for customers,
moving them away from free checking and into stronger, deeper, more profitable relationships
with the bank based on cross-selling other products, such as home equity and mortgage loans.
We also decided to continue to offer free checking.
At the beginning of 2011, approximately 70 percent of PNC’s new checking customers had
free checking accounts. By the fourth quarter of 2011, we had flipped the ratio of free checking
to relationship checking accounts, with nearly 60 percent of new customers now choosing
relationship accounts.
In our Corporate & Institutional Bank, new primary client acquisitions in Corporate Banking
were 1,165, an increase of 15 percent over the new primary clients we added in 2010. This
marks the second consecutive year we added more than 1,000 new primary clients.
In addition to adding new customers, C&IB had a record year on several other fronts: the
number of agent-led deals and new transactions in business credit as well as cross-selling its
products. Looking ahead to our opportunities in this area, if we could cross-sell our new C&IB
clients to the same degree as our existing customers, it would add approximately $200 million
of incremental revenue.
We ranked second in the number of middle market business loans arranged in 2011. As we
grow, we see opportunities to lead syndications for larger corporate clients at higher dollar
amounts.
New client acquisition in our Asset Management Group continued to grow to record levels in
2011, fueled in part by significant increases in referrals from retail branches and corporate
bankers. Overall sales were up nearly 40 percent for 2011 compared to 2010, with referral
activity representing one-third of the total sales results.
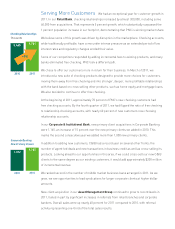
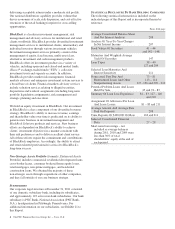
Checking Relationships
Thousands
5,465
2010 2011
5,761
+5%
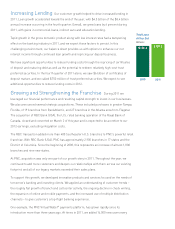
Corporate Banking
New Primary Clients
1,012
2010 2011
1,165