PNC Bank 2011 Annual Report Download - page 61
Download and view the complete annual report
Please find page 61 of the 2011 PNC Bank annual report below. You can navigate through the pages in the report by either clicking on the pages listed below, or by using the keyword search tool below to find specific information within the annual report.-
 1
1 -
2
-
3
-
4
-
5
-
6
-
7
-
8
-
9
-
10
-
11
-
12
-
13
-
14
-
15
-
16
-
17
-
18
-
19
-
20
-
21
-
22
-
23
-
24
-
25
-
26
-
27
-
28
-
29
-
30
-
31
-
32
-
33
-
34
-
35
-
36
-
37
-
38
-
39
-
40
-
41
-
42
-
43
-
44
-
45
-
46
-
47
-
48
-
49
-
50
-
 51
51 -
 52
52 -
 53
53 -
 54
54 -
 55
55 -
 56
56 -
 57
57 -
 58
58 -
 59
59 -
 60
60 -
 61
61 -
 62
62 -
 63
63 -
 64
64 -
 65
65 -
 66
66 -
 67
67 -
 68
68 -
 69
69 -
 70
70 -
 71
71 -
72
-
73
-
74
-
75
-
76
-
77
-
78
-
79
-
80
-
81
-
82
-
83
-
84
-
85
-
86
-
87
-
88
-
89
-
90
-
91
-
92
-
93
-
94
-
95
-
96
-
97
-
98
-
99
-
100
-
101
-
102
-
103
-
104
-
105
-
106
-
107
-
108
-
109
-
110
-
111
-
112
-
113
-
114
-
115
-
116
-
117
-
118
-
119
-
120
-
121
-
122
-
123
-
124
-
125
-
126
-
127
-
128
-
129
-
130
-
131
-
132
-
133
-
134
-
135
-
136
-
137
-
138
-
139
-
140
-
141
-
142
-
143
-
144
-
145
-
146
-
147
-
148
-
149
-
150
-
151
-
152
-
153
-
154
-
155
-
156
-
157
-
158
-
159
-
160
-
161
-
162
-
163
-
164
-
165
-
166
-
167
-
168
-
169
-
170
-
171
-
172
-
173
-
174
-
175
-
176
-
177
-
178
-
179
-
180
-
181
-
182
-
183
-
184
-
185
-
186
-
187
-
188
-
189
-
190
-
191
-
192
-
193
-
194
-
195
-
196
-
197
-
198
-
199
-
200
-
201
-
202
-
203
-
204
-
205
-
206
-
207
-
208
-
209
-
210
-
211
-
212
-
213
-
214
-
215
-
216
-
217
-
218
-
219
-
220
-
221
-
222
-
223
-
224
-
225
-
226
-
227
-
228
-
229
-
230
-
231
-
232
-
233
-
234
-
235
-
236
-
237
-
238
 |
 |

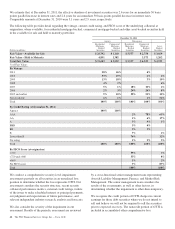
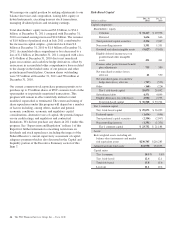
R
ETAIL
B
ANKING
(Unaudited)
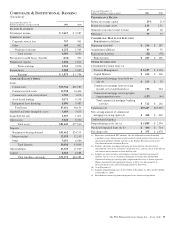
Year ended December 31
Dollars in millions, except as noted 2011 2010
I
NCOME
S
TATEMENT
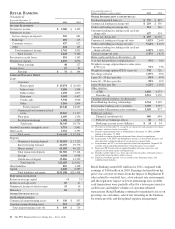
Net interest income $ 3,280 $ 3,435
Noninterest income
Service charges on deposits 510 681
Brokerage 201 213
Consumer services 927 912
Other 124 145
Total noninterest income 1,762 1,951
Total revenue 5,042 5,386
Provision for credit losses 891 1,103
Noninterest expense 4,103 4,056
Pretax earnings 48 227
Income taxes 17 83
Earnings $31$ 144
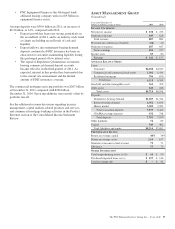
A
VERAGE
B
ALANCE
S
HEET
Loans
Consumer
Home equity $ 25,874 $ 26,450
Indirect auto 3,089 2,098
Indirect other 1,478 1,875
Education 9,103 8,497
Credit cards 3,738 3,938
Other 1,866 1,804
Total consumer 45,148 44,662
Commercial and commercial real
estate 10,567 11,177
Floor plan 1,450 1,336
Residential mortgage 1,180 1,599
Total loans 58,345 58,774
Goodwill and other intangible assets 5,751 5,861
Other assets 2,352 2,793
Total assets $ 66,448 $ 67,428
Deposits
Noninterest-bearing demand $ 18,183 $ 17,223
Interest-bearing demand 22,196 19,776
Money market 41,002 40,125
Total transaction deposits 81,381 77,124
Savings 8,098 6,938
Certificates of deposit 33,006 41,539
Total deposits 122,485 125,601
Other liabilities 855 1,458
Capital 8,168 8,439
Total liabilities and equity $131,508 $135,498
P
ERFORMANCE
R
ATIOS
Return on average capital –% 2%
Return on average assets .05 .21
Noninterest income to total revenue 35 36
Efficiency 81 75
O
THER
I
NFORMATION
(a)
Credit-related statistics:
Commercial nonperforming assets $ 336 $ 297
Consumer nonperforming assets 513 422
Total nonperforming assets (b) $ 849 $ 719
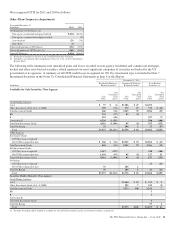
Year ended December 31
Dollars in millions, except as noted 2011 2010
O
THER
I
NFORMATION
(
CONTINUED
) (a)
Purchased impaired loans (c) $ 757 $ 895
Commercial lending net charge-offs $ 219 $ 330
Credit card lending net charge-offs 211 316
Consumer lending (excluding credit card) net
charge-offs 427 424
Total net charge-offs $ 857 $1,070
Commercial lending net charge-off ratio 1.82% 2.64%
Credit card lending net charge-off ratio 5.64% 8.02%
Consumer lending (excluding credit card) net
charge-off ratio 1.00% 1.00%
Total net charge-off ratio 1.47% 1.82%
Home equity portfolio credit statistics: (d)
% of first lien positions at origination (e) 39% 36%
Weighted-average original loan-to-value ratios
(LTVs) (e) 72% 73%
Weighted-average updated FICO scores (f) 743 726
Net charge-off ratio 1.09% .90%
Loans 30 – 59 days past due .58% .49%
Loans 60 – 89 days past due .38% .30%
Loans 90 days past due 1.22% 1.02%
Other statistics:
ATMs 6,806 6,673
Branches (g) 2,511 2,470
Customer-related statistics: (in thousands)
Retail Banking checking relationships 5,761 5,465
Retail online banking active customers 3,519 3,057
Retail online bill payment active customers 1,105 977
Brokerage statistics:
Financial consultants (h) 686 694
Full service brokerage offices 38 34
Brokerage account assets (billions) $34$34
(a) Presented as of December 31, except for net charge-offs and annualized net charge-
off ratios, which are for the year ended.
(b) Includes nonperforming loans of $810 million at December 31, 2011 and $694
million at December 31, 2010.
(c) Recorded investment of purchased impaired loans related to acquisitions.
(d) Lien position, LTV, FICO and delinquency statistics are based upon balances and
other data that exclude the impact of accounting for acquired loans.
(e) Lien positions and LTV are based upon data from loan origination. Original LTV
excludes certain acquired portfolio loans where this data is not available.
(f) Represents FICO scores that are updated monthly for home equity lines and
quarterly for the home equity installment loans.
(g) Excludes satellite offices (e.g., drive-ups, electronic branches, retirement centers)
that provide limited products and/or services.
(h) Financial consultants provide services in full service brokerage offices and
traditional bank branches.
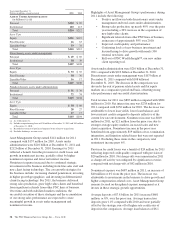
Retail Banking earned $31 million for 2011 compared with
earnings of $144 million in 2010. Earnings declined from the
prior year as lower revenues from the impact of Regulation E
rules related to overdraft fees, a low interest rate environment,
and the regulatory impact of lower interchange fees on debit
card transactions were partially offset by a lower provision for
credit losses and higher volumes of customer-initiated
transactions. Retail Banking continued to maintain its focus on
growing core customers, selectively investing in the business
for future growth, and disciplined expense management.
52 The PNC Financial Services Group, Inc. – Form 10-K