PNC Bank 2011 Annual Report Download - page 46
Download and view the complete annual report
Please find page 46 of the 2011 PNC Bank annual report below. You can navigate through the pages in the report by either clicking on the pages listed below, or by using the keyword search tool below to find specific information within the annual report.-
 1
1 -
2
-
3
-
4
-
5
-
6
-
7
-
8
-
9
-
10
-
11
-
12
-
13
-
14
-
15
-
16
-
17
-
18
-
19
-
20
-
21
-
22
-
23
-
24
-
25
-
26
-
27
-
28
-
29
-
30
-
31
-
32
-
33
-
34
-
35
-
 36
36 -
 37
37 -
 38
38 -
 39
39 -
 40
40 -
 41
41 -
 42
42 -
 43
43 -
 44
44 -
 45
45 -
 46
46 -
 47
47 -
 48
48 -
 49
49 -
 50
50 -
 51
51 -
 52
52 -
 53
53 -
 54
54 -
 55
55 -
 56
56 -
57
-
58
-
59
-
60
-
61
-
62
-
63
-
64
-
65
-
66
-
67
-
68
-
69
-
70
-
71
-
72
-
73
-
74
-
75
-
76
-
77
-
78
-
79
-
80
-
81
-
82
-
83
-
84
-
85
-
86
-
87
-
88
-
89
-
90
-
91
-
92
-
93
-
94
-
95
-
96
-
97
-
98
-
99
-
100
-
101
-
102
-
103
-
104
-
105
-
106
-
107
-
108
-
109
-
110
-
111
-
112
-
113
-
114
-
115
-
116
-
117
-
118
-
119
-
120
-
121
-
122
-
123
-
124
-
125
-
126
-
127
-
128
-
129
-
130
-
131
-
132
-
133
-
134
-
135
-
136
-
137
-
138
-
139
-
140
-
141
-
142
-
143
-
144
-
145
-
146
-
147
-
148
-
149
-
150
-
151
-
152
-
153
-
154
-
155
-
156
-
157
-
158
-
159
-
160
-
161
-
162
-
163
-
164
-
165
-
166
-
167
-
168
-
169
-
170
-
171
-
172
-
173
-
174
-
175
-
176
-
177
-
178
-
179
-
180
-
181
-
182
-
183
-
184
-
185
-
186
-
187
-
188
-
189
-
190
-
191
-
192
-
193
-
194
-
195
-
196
-
197
-
198
-
199
-
200
-
201
-
202
-
203
-
204
-
205
-
206
-
207
-
208
-
209
-
210
-
211
-
212
-
213
-
214
-
215
-
216
-
217
-
218
-
219
-
220
-
221
-
222
-
223
-
224
-
225
-
226
-
227
-
228
-
229
-
230
-
231
-
232
-
233
-
234
-
235
-
236
-
237
-
238
 |
 |
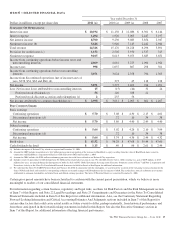
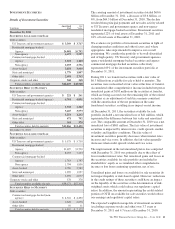
this Item 7 includes the consolidated revenue to PNC for these
services. A discussion of the consolidated revenue from these
services follows.
Treasury management revenue, which includes fees as well as
net interest income from customer deposit balances, totaled
$1.2 billion for both 2011 and 2010. Declining deposit spreads
were offset by increases in core processing products, such as
lockbox and information reporting, and in growth products
such as commercial card and healthcare related services.
Revenue from capital markets-related products and services
totaled $622 million in 2011 compared with $606 million in
2010. The comparison reflects higher derivatives and foreign
exchange sales and the reduced impact of counterparty credit
risk on valuations of derivative positions. These increases
were partially offset by lower underwriting activity.
Commercial mortgage banking activities resulted in revenue
of $112 million in 2011 compared with $262 million in 2010.
This decline was primarily due to a reduction in the value of
commercial mortgage servicing rights largely driven by lower
interest rates and higher loan prepayment rates. 2010 included
a higher level of ancillary commercial mortgage servicing fees
and revenue from a duplicative agency servicing operation
that was sold in that year.
P
ROVISION
F
OR
C
REDIT
L
OSSES
The provision for credit losses declined to $1.2 billion in 2011
compared with $2.5 billion in 2010 as overall credit quality
continued to improve due to improved economic conditions
and actions we took to reduce exposure levels during the year.
We expect our provision for credit losses in 2012 to remain
stable relative to 2011 assuming the economic outlook for
2012 will be a continuation of the 2011 environment. This
includes consideration of the impact of the pending RBC
Bank (USA) acquisition.
The Credit Risk Management portion of the Risk Management
section of this Item 7 includes additional information
regarding factors impacting the provision for credit losses. See
also Item 1A Risk Factors and the Cautionary Statement
Regarding Forward-Looking Information section of Item 7 of
this Report.
N
ONINTEREST
E
XPENSE
Noninterest expense was $9.1 billion for 2011 and $8.6 billion
for 2010. Noninterest expense for 2011 included $324 million
of residential mortgage foreclosure-related expenses primarily
as a result of ongoing governmental matters, a noncash charge
of $198 million for the unamortized discount related to
redemption of trust preferred securities, and $42 million for
integration costs. The comparable amounts for 2010 were $71
million, $0 and $387 million, respectively.
Apart from the possible impact of legal and regulatory
contingencies, charges on further trust preferred redemptions,
and RBC Bank (USA) integration expenses in 2012, and
excluding the fourth quarter charge for residential mortgage
foreclosure-related expenses of $240 million and the noncash
charge of $198 million related to the trust preferred securities
redemption in 2011, we expect that total noninterest expense
for 2012 will increase in percentage terms by mid single-digits
compared to 2011. This expectation reflects flat-to-down
expense for PNC stand alone and 10 months of RBC Bank
(USA) operating expenses of approximately $600 million.
In connection with the pending acquisition of RBC Bank
(USA) in March 2012, we expect to incur total merger and
integration costs of approximately $170 million in the first
quarter of 2012.
E
FFECTIVE
I
NCOME
T
AX
R
ATE
The effective income tax rate was 24.5% in 2011 compared
with 25.5% in 2010. The decrease in the effective tax rate was
primarily attributable to the impact of higher tax-exempt
income and tax credits.
The PNC Financial Services Group, Inc. – Form 10-K 37