PNC Bank 2011 Annual Report Download - page 82
Download and view the complete annual report
Please find page 82 of the 2011 PNC Bank annual report below. You can navigate through the pages in the report by either clicking on the pages listed below, or by using the keyword search tool below to find specific information within the annual report.-
 1
1 -
2
-
3
-
4
-
5
-
6
-
7
-
8
-
9
-
10
-
11
-
12
-
13
-
14
-
15
-
16
-
17
-
18
-
19
-
20
-
21
-
22
-
23
-
24
-
25
-
26
-
27
-
28
-
29
-
30
-
31
-
32
-
33
-
34
-
35
-
36
-
37
-
38
-
39
-
40
-
41
-
42
-
43
-
44
-
45
-
46
-
47
-
48
-
49
-
50
-
51
-
52
-
53
-
54
-
55
-
56
-
57
-
58
-
59
-
60
-
61
-
62
-
63
-
64
-
65
-
66
-
67
-
68
-
69
-
70
-
71
-
 72
72 -
 73
73 -
 74
74 -
 75
75 -
 76
76 -
 77
77 -
 78
78 -
 79
79 -
 80
80 -
 81
81 -
 82
82 -
 83
83 -
 84
84 -
 85
85 -
 86
86 -
 87
87 -
 88
88 -
 89
89 -
 90
90 -
 91
91 -
 92
92 -
93
-
94
-
95
-
96
-
97
-
98
-
99
-
100
-
101
-
102
-
103
-
104
-
105
-
106
-
107
-
108
-
109
-
110
-
111
-
112
-
113
-
114
-
115
-
116
-
117
-
118
-
119
-
120
-
121
-
122
-
123
-
124
-
125
-
126
-
127
-
128
-
129
-
130
-
131
-
132
-
133
-
134
-
135
-
136
-
137
-
138
-
139
-
140
-
141
-
142
-
143
-
144
-
145
-
146
-
147
-
148
-
149
-
150
-
151
-
152
-
153
-
154
-
155
-
156
-
157
-
158
-
159
-
160
-
161
-
162
-
163
-
164
-
165
-
166
-
167
-
168
-
169
-
170
-
171
-
172
-
173
-
174
-
175
-
176
-
177
-
178
-
179
-
180
-
181
-
182
-
183
-
184
-
185
-
186
-
187
-
188
-
189
-
190
-
191
-
192
-
193
-
194
-
195
-
196
-
197
-
198
-
199
-
200
-
201
-
202
-
203
-
204
-
205
-
206
-
207
-
208
-
209
-
210
-
211
-
212
-
213
-
214
-
215
-
216
-
217
-
218
-
219
-
220
-
221
-
222
-
223
-
224
-
225
-
226
-
227
-
228
-
229
-
230
-
231
-
232
-
233
-
234
-
235
-
236
-
237
-
238
 |
 |
aggregation measure is supplemented with secondary
measures of risk to arrive at an estimate of corporate-wide
risk. The economic capital framework is a measure of
potential losses above and beyond expected losses. Our capital
management practices incorporate risks associated with
potential credit losses (Credit Risk); fluctuations of the
estimated market value of financial instruments (Market
Risk); failure of people, processes or systems (Operational
Risk); calculations, assumptions, and validation of internal
measurements (Model Risk); and losses associated with
declining margins and/or fees, and the fixed cost structure of
the business. We estimate credit and market risks at pool and
exposure levels while we estimate the remaining risk types at
an institution or business segment level.
Risk Management Strategies
Risk management is not about eliminating risks, but about
identifying and accepting risks and then working to effectively
manage them so as to optimize all aspects of shareholder
value.
We centrally manage policy development, exception approval,
and oversight through our corporate-level risk management
structure. Some of these policies express our risk appetite
through limits to the acceptable level of risk. If we are in
excess of certain limits, we implement strategies designed to
progressively manage our risks to be within acceptable
tolerances. We also review and revise certain policies to better
reflect specific business requirements of our changing
organization. This risk management structure also affords us
opportunities to take action in either preventing or mitigating
unapproved exceptions to policies. PNC’s Internal Audit
function also performs its own assessment of our internal
control environment. Internal Audit plays a critical role in risk
management, testing the operation of the internal control
system and reporting findings to management and to the Audit
Committee of the Board.
Risk Monitoring and Reporting
Monitoring and evaluation of controls help to provide
assurance that controls are effective, and can also result in the
identification of opportunities to improve risk controls. Our
risk reporting provides an overall risk aggregation and
transparent communication of these aggregated risks. Risk
reports are produced at the line of business level, the
functional level (credit, market, operational), and at the
corporate level. Our enterprise risk profile is a point-in-time
assessment of corporate-wide risk. The risk profile represents
PNC’s overall risk position in relation to the desired corporate
risk appetite. The determination of the risk profile’s position is
based on comprehensive and subjective analysis of reported
risk limits, metrics, operating guidelines, and qualitative
assessments.
C
REDIT
R
ISK
M
ANAGEMENT
Credit risk represents the possibility that a customer,
counterparty or issuer may not perform in accordance with
contractual terms. Credit risk is inherent in the financial
services business and results from extending credit to
customers, purchasing securities, and entering into financial
derivative transactions and certain guarantee contracts. Credit
risk is one of our most significant risks. Our processes for
managing credit risk are embedded in PNC’s risk culture and
in our decision-making processes using a systematic approach
whereby credit risks and related exposures are: identified and
assessed; managed through specific policies and processes;
measured and evaluated against our risk tolerance limits; and
reported, along with specific mitigation activities, to
management and the board through our governance structure.
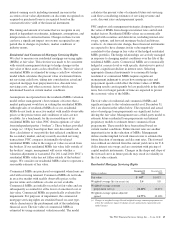
Asset Quality Overview
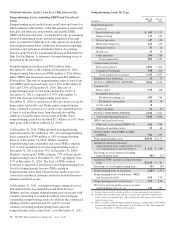
Overall asset quality trends for 2011 were positive and
included the following:
• Overall loan delinquencies, excluding government
insured or guaranteed loans, have declined from
year-end 2010 levels helped by the slowly improving
economy.
• Aided by a continued, albeit slowly, improving
economy, nonperforming loans declined $906
million, or 20%, to $3.6 billion as of December 31,
2011 compared with December 31, 2010. Similarly,
nonperforming assets decreased $967 million, or
19%, to $4.2 billion as of December 31, 2011,
compared with December 31, 2010.
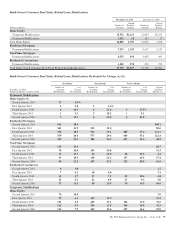
• Commercial credit quality trends improved
noticeably with levels of criticized commercial loan
outstandings declining by approximately $3.8 billion,
or 28% compared with December 31, 2010, to $9.9
billion at December 31, 2011. See Note 5 Asset
Quality and Allowances for Loan and Lease Losses
and Unfunded Loan Commitments and Letters of
Credit in the Notes To Consolidated Financial
Statements in Item 8 of this Report for additional
information.
• Net charge-offs declined significantly to $1.6 billion,
down 44% from 2010 net charge-offs of $2.9 billion.
• Reflecting improvements in asset quality, the
provision for credit losses declined to $1.2 billion for
2011 compared with $2.5 billion for 2010.
• The level of ALLL has decreased to $4.3 billion at
December 31, 2011 from $4.9 billion at
December 31, 2010.
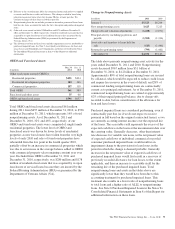
These positive trends were partially offset by our ongoing loan
modification efforts to assist homeowners and other
borrowers. These efforts continued to increase our overall
level of troubled debt restructurings (TDRs). In particular,
TDRs included in nonperforming loans increased to 32% of
total nonperforming loans. However, as the economy has
slowly improved, the amount of TDRs returning to performing
status has increased.
The PNC Financial Services Group, Inc. – Form 10-K 73