PNC Bank 2011 Annual Report Download - page 136
Download and view the complete annual report
Please find page 136 of the 2011 PNC Bank annual report below. You can navigate through the pages in the report by either clicking on the pages listed below, or by using the keyword search tool below to find specific information within the annual report.-
 1
1 -
2
-
3
-
4
-
5
-
6
-
7
-
8
-
9
-
10
-
11
-
12
-
13
-
14
-
15
-
16
-
17
-
18
-
19
-
20
-
21
-
22
-
23
-
24
-
25
-
26
-
27
-
28
-
29
-
30
-
31
-
32
-
33
-
34
-
35
-
36
-
37
-
38
-
39
-
40
-
41
-
42
-
43
-
44
-
45
-
46
-
47
-
48
-
49
-
50
-
51
-
52
-
53
-
54
-
55
-
56
-
57
-
58
-
59
-
60
-
61
-
62
-
63
-
64
-
65
-
66
-
67
-
68
-
69
-
70
-
71
-
72
-
73
-
74
-
75
-
76
-
77
-
78
-
79
-
80
-
81
-
82
-
83
-
84
-
85
-
86
-
87
-
88
-
89
-
90
-
91
-
92
-
93
-
94
-
95
-
96
-
97
-
98
-
99
-
100
-
101
-
102
-
103
-
104
-
105
-
106
-
107
-
108
-
109
-
110
-
111
-
112
-
113
-
114
-
115
-
116
-
117
-
118
-
119
-
120
-
121
-
122
-
123
-
124
-
125
-
 126
126 -
 127
127 -
 128
128 -
 129
129 -
 130
130 -
 131
131 -
 132
132 -
 133
133 -
 134
134 -
 135
135 -
 136
136 -
 137
137 -
 138
138 -
 139
139 -
 140
140 -
 141
141 -
 142
142 -
 143
143 -
 144
144 -
 145
145 -
 146
146 -
147
-
148
-
149
-
150
-
151
-
152
-
153
-
154
-
155
-
156
-
157
-
158
-
159
-
160
-
161
-
162
-
163
-
164
-
165
-
166
-
167
-
168
-
169
-
170
-
171
-
172
-
173
-
174
-
175
-
176
-
177
-
178
-
179
-
180
-
181
-
182
-
183
-
184
-
185
-
186
-
187
-
188
-
189
-
190
-
191
-
192
-
193
-
194
-
195
-
196
-
197
-
198
-
199
-
200
-
201
-
202
-
203
-
204
-
205
-
206
-
207
-
208
-
209
-
210
-
211
-
212
-
213
-
214
-
215
-
216
-
217
-
218
-
219
-
220
-
221
-
222
-
223
-
224
-
225
-
226
-
227
-
228
-
229
-
230
-
231
-
232
-
233
-
234
-
235
-
236
-
237
-
238
 |
 |

N
OTE
4L
OANS AND
C
OMMITMENTS TO
E
XTEND
C
REDIT
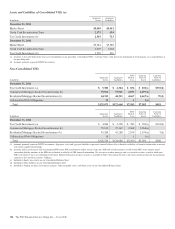
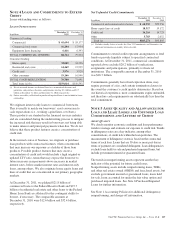
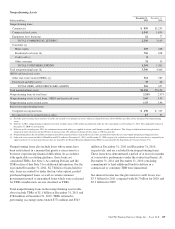
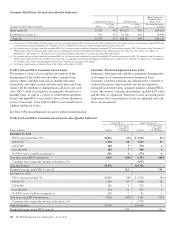
Loans outstanding were as follows:
L
OANS
O
UTSTANDING
In millions
December 31
2011
December 31
2010
Commercial lending
Commercial $ 65,694 $ 55,177
Commercial real estate 16,204 17,934
Equipment lease financing 6,416 6,393
TOTAL COMMERCIAL LENDING 88,314 79,504
Consumer lending
Home equity 33,089 34,226
Residential real estate 14,469 15,999
Credit card 3,976 3,920
Other consumer 19,166 16,946
TOTAL CONSUMER LENDING 70,700 71,091
Total loans (a) (b) $159,014 $150,595
(a) Net of unearned income, net deferred loan fees, unamortized discounts and
premiums, and purchase discounts and premiums totaling $2.3 billion and $2.7
billion at December 31, 2011 and December 31, 2010, respectively.
(b) Future accretable yield related to purchased impaired loans is not included in loans
outstanding.
We originate interest-only loans to commercial borrowers.
This is usually to match our borrowers’ asset conversion to
cash expectations (i.e., working capital lines, revolvers).
These products are standard in the financial services industry
and are considered during the underwriting process to mitigate
the increased risk that may result in borrowers not being able
to make interest and principal payments when due. We do not
believe that these product features create a concentration of
credit risk.
In the normal course of business, we originate or purchase
loan products with contractual features, when concentrated,
that may increase our exposure as a holder of those loan
products. Possible product features that may create a
concentration of credit risk would include a high original or
updated LTV ratio, terms that may expose the borrower to
future increases in repayments above increases in market
interest rates, below-market interest rates and interest-only
loans, among others. We also originate home equity loans and
lines of credit that are concentrated in our primary geographic
markets.
At December 31, 2011, we pledged $21.8 billion of
commercial loans to the Federal Reserve Bank and $27.7
billion of residential real estate and other loans to the Federal
Home Loan Bank as collateral for the contingent ability to
borrow, if necessary. The comparable amounts at
December 31, 2010 were $12.6 billion and $32.4 billion,
respectively.
Net Unfunded Credit Commitments
In millions
December 31
2011
December 31
2010
Commercial and commercial real estate $ 64,955 $59,256
Home equity lines of credit 18,317 19,172
Credit card 16,216 14,725
Other 3,783 2,652
Total (a) $103,271 $95,805
(a) Excludes standby letters of credit. See Note 23 Commitments and Guarantees for
additional information on standby letters of credit.
Commitments to extend credit represent arrangements to lend
funds or provide liquidity subject to specified contractual
conditions. At December 31, 2011, commercial commitments
reported above exclude $20.2 billion of syndications,
assignments and participations, primarily to financial
institutions. The comparable amount at December 31, 2010
was $16.7 billion.
Commitments generally have fixed expiration dates, may
require payment of a fee, and contain termination clauses in
the event the customer’s credit quality deteriorates. Based on
our historical experience, most commitments expire unfunded,
and therefore cash requirements are substantially less than the
total commitment.
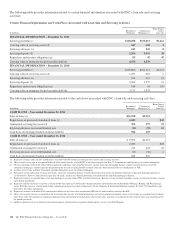
N
OTE
5A
SSET
Q
UALITY AND
A
LLOWANCES FOR
L
OAN AND
L
EASE
L
OSSES AND
U
NFUNDED
L
OAN
C
OMMITMENTS AND
L
ETTERS OF
C
REDIT
A
SSET
Q
UALITY
We closely monitor economic conditions and loan performance
trends to manage and evaluate our exposure to credit risk. Trends
in delinquency rates are a key indicator, among other
considerations, of credit risk within the loan portfolios. The
measurement of delinquency status is based on the contractual
terms of each loan. Loans that are 30 days or more past due in
terms of payment are considered delinquent. Loan delinquencies
exclude loans held for sale and purchased impaired loans, but
include government insured or guaranteed loans.
The trends in nonperforming assets represent another key
indicator of the potential for future credit losses.
Nonperforming assets include nonperforming loans, TDRs,
and other real estate owned (OREO) and foreclosed assets, but
exclude government insured or guaranteed loans, loans held
for sale, loans accounted for under the fair value option and
purchased impaired loans. See Note 6 Purchased Impaired
Loans for further information.
See Note 1 Accounting Policies for additional delinquency,
nonperforming, and charge-off information.
The PNC Financial Services Group, Inc. – Form 10-K 127