PNC Bank 2011 Annual Report Download - page 155
Download and view the complete annual report
Please find page 155 of the 2011 PNC Bank annual report below. You can navigate through the pages in the report by either clicking on the pages listed below, or by using the keyword search tool below to find specific information within the annual report.-
 1
1 -
2
-
3
-
4
-
5
-
6
-
7
-
8
-
9
-
10
-
11
-
12
-
13
-
14
-
15
-
16
-
17
-
18
-
19
-
20
-
21
-
22
-
23
-
24
-
25
-
26
-
27
-
28
-
29
-
30
-
31
-
32
-
33
-
34
-
35
-
36
-
37
-
38
-
39
-
40
-
41
-
42
-
43
-
44
-
45
-
46
-
47
-
48
-
49
-
50
-
51
-
52
-
53
-
54
-
55
-
56
-
57
-
58
-
59
-
60
-
61
-
62
-
63
-
64
-
65
-
66
-
67
-
68
-
69
-
70
-
71
-
72
-
73
-
74
-
75
-
76
-
77
-
78
-
79
-
80
-
81
-
82
-
83
-
84
-
85
-
86
-
87
-
88
-
89
-
90
-
91
-
92
-
93
-
94
-
95
-
96
-
97
-
98
-
99
-
100
-
101
-
102
-
103
-
104
-
105
-
106
-
107
-
108
-
109
-
110
-
111
-
112
-
113
-
114
-
115
-
116
-
117
-
118
-
119
-
120
-
121
-
122
-
123
-
124
-
125
-
126
-
127
-
128
-
129
-
130
-
131
-
132
-
133
-
134
-
135
-
136
-
137
-
138
-
139
-
140
-
141
-
142
-
143
-
144
-
 145
145 -
 146
146 -
 147
147 -
 148
148 -
 149
149 -
 150
150 -
 151
151 -
 152
152 -
 153
153 -
 154
154 -
 155
155 -
 156
156 -
 157
157 -
 158
158 -
 159
159 -
 160
160 -
 161
161 -
 162
162 -
 163
163 -
 164
164 -
 165
165 -
166
-
167
-
168
-
169
-
170
-
171
-
172
-
173
-
174
-
175
-
176
-
177
-
178
-
179
-
180
-
181
-
182
-
183
-
184
-
185
-
186
-
187
-
188
-
189
-
190
-
191
-
192
-
193
-
194
-
195
-
196
-
197
-
198
-
199
-
200
-
201
-
202
-
203
-
204
-
205
-
206
-
207
-
208
-
209
-
210
-
211
-
212
-
213
-
214
-
215
-
216
-
217
-
218
-
219
-
220
-
221
-
222
-
223
-
224
-
225
-
226
-
227
-
228
-
229
-
230
-
231
-
232
-
233
-
234
-
235
-
236
-
237
-
238
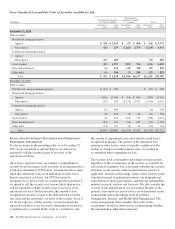
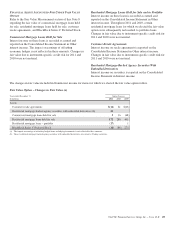
 |
 |

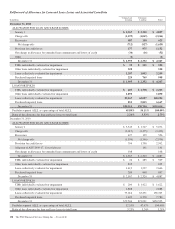
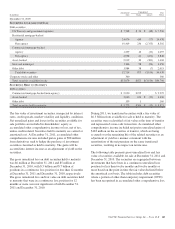
During 2011 and 2010, the OTTI credit losses recognized in noninterest income related to estimated credit losses on securities that
we do not expect to sell were as follows:
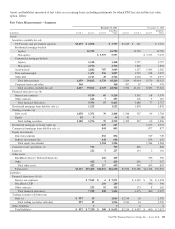
Summary of OTTI Credit Losses Recognized in Earnings
Year ended December 31
In millions 2011 2010
Available for sale securities:
Non-agency residential mortgage-backed $(130) $(242)
Non-agency commercial mortgage-backed (5)
Asset-backed (21) (78)
Other debt (1)
Total $(152) $(325)
Summary of OTTI Noncredit Losses Included in Accumulated Other Comprehensive Loss
In millions 2011 2010
Total $(268) $(283)
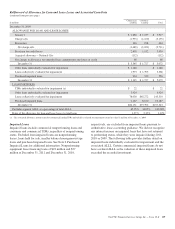
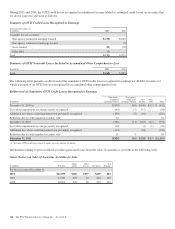
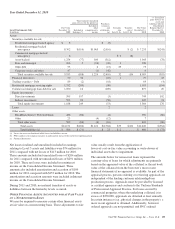
The following table presents a rollforward of the cumulative OTTI credit losses recognized in earnings for all debt securities for
which a portion of an OTTI loss was recognized in accumulated other comprehensive loss:
Rollforward of Cumulative OTTI Credit Losses Recognized in Earnings
In millions
Non-agency
residential
mortgage-backed
Non-agency
commercial
mortgage-backed
Asset-
backed
Other
debt Total
December 31, 2009 (a) $(479) $(6) $(145) $(12) $ (642)
Loss where impairment was not previously recognized (44) (3) (17) (64)
Additional loss where credit impairment was previously recognized (198) (2) (61) (261)
Reduction due to credit impaired securities sold 12 12
December 31, 2010 (709) (11) (223) (12) (955)
Loss where impairment was not previously recognized (18) (3) (1) (22)
Additional loss where credit impairment was previously recognized (112) (18) (130)
Reduction due to credit impaired securities sold 11 5 16
December 31, 2011 $(828) $(6) $(244) $(13) $(1,091)
(a) Excludes OTTI credit losses related to equity securities totaling $4 million.
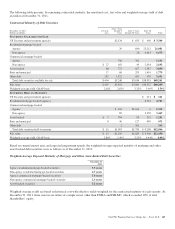
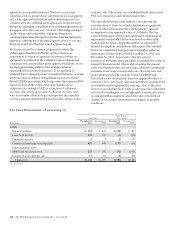
Information relating to gross realized securities gains and losses from the sales of securities is set forth in the following table.
Gains (Losses) on Sales of Securities Available for Sale
In millions Proceeds
Gross
Gains
Gross
Losses Net Gains
Tax
Expense
For the year ended December 31
2011 $21,039 $406 $157 $249 $87
2010 23,783 490 64 426 149
2009 18,901 570 20 550 192
146 The PNC Financial Services Group, Inc. – Form 10-K