PNC Bank 2011 Annual Report Download - page 214
Download and view the complete annual report
Please find page 214 of the 2011 PNC Bank annual report below. You can navigate through the pages in the report by either clicking on the pages listed below, or by using the keyword search tool below to find specific information within the annual report.-
 1
1 -
2
-
3
-
4
-
5
-
6
-
7
-
8
-
9
-
10
-
11
-
12
-
13
-
14
-
15
-
16
-
17
-
18
-
19
-
20
-
21
-
22
-
23
-
24
-
25
-
26
-
27
-
28
-
29
-
30
-
31
-
32
-
33
-
34
-
35
-
36
-
37
-
38
-
39
-
40
-
41
-
42
-
43
-
44
-
45
-
46
-
47
-
48
-
49
-
50
-
51
-
52
-
53
-
54
-
55
-
56
-
57
-
58
-
59
-
60
-
61
-
62
-
63
-
64
-
65
-
66
-
67
-
68
-
69
-
70
-
71
-
72
-
73
-
74
-
75
-
76
-
77
-
78
-
79
-
80
-
81
-
82
-
83
-
84
-
85
-
86
-
87
-
88
-
89
-
90
-
91
-
92
-
93
-
94
-
95
-
96
-
97
-
98
-
99
-
100
-
101
-
102
-
103
-
104
-
105
-
106
-
107
-
108
-
109
-
110
-
111
-
112
-
113
-
114
-
115
-
116
-
117
-
118
-
119
-
120
-
121
-
122
-
123
-
124
-
125
-
126
-
127
-
128
-
129
-
130
-
131
-
132
-
133
-
134
-
135
-
136
-
137
-
138
-
139
-
140
-
141
-
142
-
143
-
144
-
145
-
146
-
147
-
148
-
149
-
150
-
151
-
152
-
153
-
154
-
155
-
156
-
157
-
158
-
159
-
160
-
161
-
162
-
163
-
164
-
165
-
166
-
167
-
168
-
169
-
170
-
171
-
172
-
173
-
174
-
175
-
176
-
177
-
178
-
179
-
180
-
181
-
182
-
183
-
184
-
185
-
186
-
187
-
188
-
189
-
190
-
191
-
192
-
193
-
194
-
195
-
196
-
197
-
198
-
199
-
200
-
201
-
202
-
203
-
 204
204 -
 205
205 -
 206
206 -
 207
207 -
 208
208 -
 209
209 -
 210
210 -
 211
211 -
 212
212 -
 213
213 -
 214
214 -
 215
215 -
 216
216 -
 217
217 -
 218
218 -
 219
219 -
 220
220 -
 221
221 -
 222
222 -
 223
223 -
 224
224 -
225
-
226
-
227
-
228
-
229
-
230
-
231
-
232
-
233
-
234
-
235
-
236
-
237
-
238
 |
 |

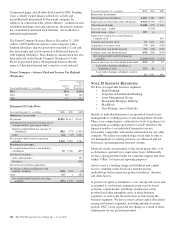
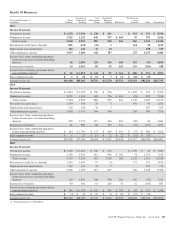
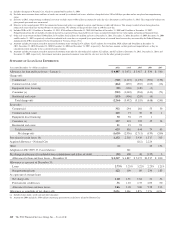
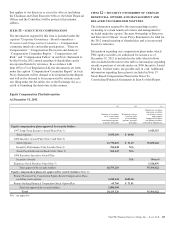
Results Of Businesses
Year ended December 31
In millions
Retail
Banking
Corporate &
Institutional
Banking
Asset
Management
Group
Residential
Mortgage
Banking BlackRock
Non-Strategic
Assets
Portfolio Other Consolidated
2011
Income Statement
Net interest income $ 3,278 $ 3,344 $ 238 $ 201 $ 913 $ 726 $ 8,700
Noninterest income 1,762 1,252 649 747 $ 464 47 705 5,626
Total revenue 5,040 4,596 887 948 464 960 1,431 14,326
Provision for credit losses (benefit) 891 (124) (24) 5 366 38 1,152
Depreciation and amortization 186 144 41 10 278 659
Other noninterest expense 3,917 1,686 646 787 275 1,135 8,446
Income (loss) from continuing operations
before income taxes and noncontrolling
interests 46 2,890 224 146 464 319 (20) 4,069
Income taxes (benefit) 15 1,015 83 59 103 119 (396) 998
Income from continuing operations before
noncontrolling interests $ 31 $ 1,875 $ 141 $ 87 $ 361 $ 200 $ 376 $ 3,071
Inter-segment revenue $ 1 $ 20 $ 13 $ 7 $ 16 $ (10) $ (47)
Average Assets (a) $66,448 $81,043 $6,719 $11,270 $5,516 $13,119 $81,220 $265,335
2010
Income Statement
Net interest income $ 3,433 $ 3,535 $ 256 $ 256 $ 1,229 $ 521 $ 9,230
Noninterest income 1,951 1,363 628 736 $ 462 (93) 899 5,946
Total revenue 5,384 4,898 884 992 462 1,136 1,420 15,176
Provision for credit losses 1,103 303 20 5 976 95 2,502
Depreciation and amortization 218 148 41 3 287 697
Other noninterest expense 3,838 1,673 606 560 250 989 7,916
Income (loss) from continuing operations
before income taxes and noncontrolling
interests 225 2,774 217 424 462 (90) 49 4,061
Income taxes (benefit) 81 980 80 155 111 (33) (337) 1,037
Income (loss) from continuing operations
before noncontrolling interests $ 144 $ 1,794 $ 137 $ 269 $ 351 $ (57) $ 386 $ 3,024
Inter-segment revenue $ 1 21 $ 13 $ 12 $ 22 $ (12) $ (57)
Average Assets (a) $67,428 $77,540 $6,954 $ 9,247 $5,428 $17,517 $80,788 $264,902
2009
Income Statement
Net interest income $3,520 $ 3,801 $ 308 $ 332 $ 1,079 $ 43 $ 9,083
Noninterest income 2,199 1,433 611 996 $ 262 74 1,570 7,145
Total revenue 5,719 5,234 919 1,328 262 1,153 1,613 16,228
Provision for credit losses (benefit) 1,330 1,603 97 (4) 771 133 3,930
Depreciation and amortization 263 141 41 5 323 773
Other noninterest expense 3,906 1,659 613 627 246 1,249 8,300
Income (loss) from continuing operations
before income taxes and noncontrolling
interests 220 1,831 168 700 262 136 (92) 3,225
Income taxes (benefit) 84 641 63 265 55 52 (293) 867
Income from continuing operations before
noncontrolling interests $136 $ 1,190 $ 105 $ 435 $ 207 $ 84 $ 201 $ 2,358
Inter-segment revenue $(3) $ 11 $ 18 $ 6 $ 16 $ (17) $ (31)
Average Assets (a) $65,320 $84,689 $7,320 $ 8,420 $6,249 $22,844 $82,034 $276,876
(a) Period-end balances for BlackRock.
The PNC Financial Services Group, Inc. – Form 10-K 205