PNC Bank 2011 Annual Report Download - page 162
Download and view the complete annual report
Please find page 162 of the 2011 PNC Bank annual report below. You can navigate through the pages in the report by either clicking on the pages listed below, or by using the keyword search tool below to find specific information within the annual report.-
 1
1 -
2
-
3
-
4
-
5
-
6
-
7
-
8
-
9
-
10
-
11
-
12
-
13
-
14
-
15
-
16
-
17
-
18
-
19
-
20
-
21
-
22
-
23
-
24
-
25
-
26
-
27
-
28
-
29
-
30
-
31
-
32
-
33
-
34
-
35
-
36
-
37
-
38
-
39
-
40
-
41
-
42
-
43
-
44
-
45
-
46
-
47
-
48
-
49
-
50
-
51
-
52
-
53
-
54
-
55
-
56
-
57
-
58
-
59
-
60
-
61
-
62
-
63
-
64
-
65
-
66
-
67
-
68
-
69
-
70
-
71
-
72
-
73
-
74
-
75
-
76
-
77
-
78
-
79
-
80
-
81
-
82
-
83
-
84
-
85
-
86
-
87
-
88
-
89
-
90
-
91
-
92
-
93
-
94
-
95
-
96
-
97
-
98
-
99
-
100
-
101
-
102
-
103
-
104
-
105
-
106
-
107
-
108
-
109
-
110
-
111
-
112
-
113
-
114
-
115
-
116
-
117
-
118
-
119
-
120
-
121
-
122
-
123
-
124
-
125
-
126
-
127
-
128
-
129
-
130
-
131
-
132
-
133
-
134
-
135
-
136
-
137
-
138
-
139
-
140
-
141
-
142
-
143
-
144
-
145
-
146
-
147
-
148
-
149
-
150
-
151
-
 152
152 -
 153
153 -
 154
154 -
 155
155 -
 156
156 -
 157
157 -
 158
158 -
 159
159 -
 160
160 -
 161
161 -
 162
162 -
 163
163 -
 164
164 -
 165
165 -
 166
166 -
 167
167 -
 168
168 -
 169
169 -
 170
170 -
 171
171 -
 172
172 -
173
-
174
-
175
-
176
-
177
-
178
-
179
-
180
-
181
-
182
-
183
-
184
-
185
-
186
-
187
-
188
-
189
-
190
-
191
-
192
-
193
-
194
-
195
-
196
-
197
-
198
-
199
-
200
-
201
-
202
-
203
-
204
-
205
-
206
-
207
-
208
-
209
-
210
-
211
-
212
-
213
-
214
-
215
-
216
-
217
-
218
-
219
-
220
-
221
-
222
-
223
-
224
-
225
-
226
-
227
-
228
-
229
-
230
-
231
-
232
-
233
-
234
-
235
-
236
-
237
-
238
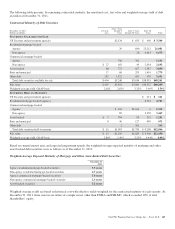
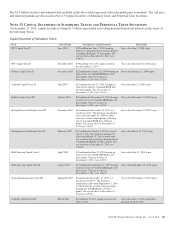
 |
 |

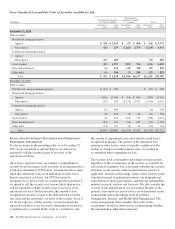
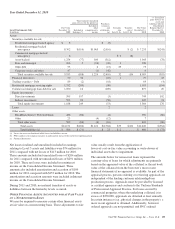
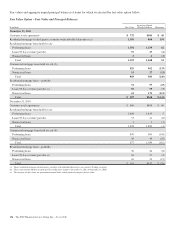
Year Ended December 31, 2010
Level 3 Instruments Only
In millions
Fair Value
December 31,
2009
Total realized / unrealized
gains (losses) for the period (a) Purchases,
issuances,
and
settlements,
net
Transfers
into
Level 3 (b)
Transfers
out of
Level 3 (b)
Fair Value
December 31,
2010
(*) Unrealized
gains (losses) on
assets and
liabilities held on
Consolidated
Balance Sheet at
December 31,
2010
Included in
Earnings (*)
Included in
other
comprehensive
income
Assets
Securities available for sale
Residential mortgage-backed agency $ 5 $ (5)
Residential mortgage-backed
non-agency 8,302 $(116) $1,065 (2,016) $ (2) $ 7,233 $(241)
Commercial mortgage-backed
non-agency 6 $ 2 (8)
Asset-backed 1,254 (77) 180 (312) 1,045 (78)
State and municipal 266 5 (24) (20) 1 228
Other debt 53 6 (15) 29 73
Corporate stocks and other 47 (1) (42) 4
Total securities available for sale 9,933 (188) 1,226 (2,410) 32 (10) 8,583 (319)
Financial derivatives 50 36 (10) 1 77 43
Trading securities – Debt 89 (2) (18) 69 (4)
Residential mortgage servicing rights 1,332 (209) (90) 1,033 (194)
Commercial mortgage loans held for sale 1,050 16 (189) 877 20
Equity investments
Direct investments 595 157 (3) 749 102
Indirect investments 593 92 (50) 635 74
Total equity investments 1,188 249 (53) 1,384 176
Loans 22
Other assets
BlackRock Series C Preferred Stock 486 (86) (4) 396 (86)
Other 23 (4) (12) 7
Total other assets 509 (86) (4) (16) 403 (86)
Total assets $14,151 $(184) $1,222 $(2,784) $33 $(10) $12,428 $(364)
Total liabilities (c) $ 506 $ (71) $ 23 $ 2 $ 460 $ (73)
(a) Losses for assets are bracketed while losses for liabilities are not.
(b) PNC’s policy is to recognize transfers in and transfers out as of the end of the reporting period.
(c) Financial derivatives.
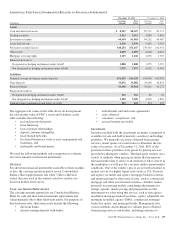
Net losses (realized and unrealized) included in earnings
relating to Level 3 assets and liabilities were $74 million for
2011 compared with net losses of $113 million for 2010.
These amounts included net unrealized losses of $204 million
for 2011 compared with net unrealized losses of $291 million
for 2010. These net losses were included in noninterest
income on the Consolidated Income Statement. These
amounts also included amortization and accretion of $109
million for 2011 compared with $153 million for 2010. The
amortization and accretion amounts were included in Interest
income on the Consolidated Income Statement.
During 2011 and 2010, no material transfers of assets or
liabilities between the hierarchy levels occurred.
O
THER
F
INANCIAL
A
SSETS
A
CCOUNTED FOR AT
F
AIR
V
ALUE
ON A
N
ONRECURRING
B
ASIS
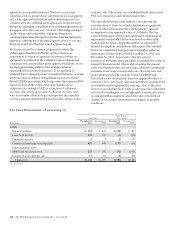
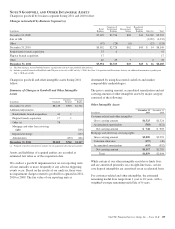
We may be required to measure certain other financial assets
at fair value on a nonrecurring basis. These adjustments to fair
value usually result from the application of
lower-of-cost-or-fair value accounting or write-downs of
individual assets due to impairment.
The amounts below for nonaccrual loans represent the
carrying value of loans for which adjustments are primarily
based on the appraised value of the collateral or the net book
value of the collateral from the borrower’s most recent
financial statements if no appraisal is available. As part of the
appraisal process, persons ordering or reviewing appraisals are
independent of the lending customer relationship/loan
production process. Appraisals must be provided by licensed
or certified appraisers and conform to the Uniform Standards
of Professional Appraisal Practice. For loans secured by
commercial properties where the underlying collateral is in
excess of $250,000, appraisals are obtained at least annually.
In certain instances (e.g., physical changes in the property), a
more recent appraisal is obtained. Additionally, borrower
ordered appraisals are not permitted, and PNC ordered
The PNC Financial Services Group, Inc. – Form 10-K 153