PNC Bank 2011 Annual Report Download - page 67
Download and view the complete annual report
Please find page 67 of the 2011 PNC Bank annual report below. You can navigate through the pages in the report by either clicking on the pages listed below, or by using the keyword search tool below to find specific information within the annual report.-
 1
1 -
2
-
3
-
4
-
5
-
6
-
7
-
8
-
9
-
10
-
11
-
12
-
13
-
14
-
15
-
16
-
17
-
18
-
19
-
20
-
21
-
22
-
23
-
24
-
25
-
26
-
27
-
28
-
29
-
30
-
31
-
32
-
33
-
34
-
35
-
36
-
37
-
38
-
39
-
40
-
41
-
42
-
43
-
44
-
45
-
46
-
47
-
48
-
49
-
50
-
51
-
52
-
53
-
54
-
55
-
56
-
 57
57 -
 58
58 -
 59
59 -
 60
60 -
 61
61 -
 62
62 -
 63
63 -
 64
64 -
 65
65 -
 66
66 -
 67
67 -
 68
68 -
 69
69 -
 70
70 -
 71
71 -
 72
72 -
 73
73 -
 74
74 -
 75
75 -
 76
76 -
 77
77 -
78
-
79
-
80
-
81
-
82
-
83
-
84
-
85
-
86
-
87
-
88
-
89
-
90
-
91
-
92
-
93
-
94
-
95
-
96
-
97
-
98
-
99
-
100
-
101
-
102
-
103
-
104
-
105
-
106
-
107
-
108
-
109
-
110
-
111
-
112
-
113
-
114
-
115
-
116
-
117
-
118
-
119
-
120
-
121
-
122
-
123
-
124
-
125
-
126
-
127
-
128
-
129
-
130
-
131
-
132
-
133
-
134
-
135
-
136
-
137
-
138
-
139
-
140
-
141
-
142
-
143
-
144
-
145
-
146
-
147
-
148
-
149
-
150
-
151
-
152
-
153
-
154
-
155
-
156
-
157
-
158
-
159
-
160
-
161
-
162
-
163
-
164
-
165
-
166
-
167
-
168
-
169
-
170
-
171
-
172
-
173
-
174
-
175
-
176
-
177
-
178
-
179
-
180
-
181
-
182
-
183
-
184
-
185
-
186
-
187
-
188
-
189
-
190
-
191
-
192
-
193
-
194
-
195
-
196
-
197
-
198
-
199
-
200
-
201
-
202
-
203
-
204
-
205
-
206
-
207
-
208
-
209
-
210
-
211
-
212
-
213
-
214
-
215
-
216
-
217
-
218
-
219
-
220
-
221
-
222
-
223
-
224
-
225
-
226
-
227
-
228
-
229
-
230
-
231
-
232
-
233
-
234
-
235
-
236
-
237
-
238
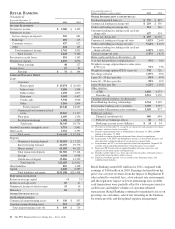
 |
 |

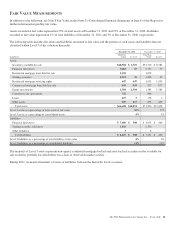
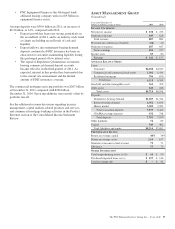
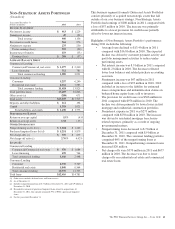
Year ended December 31
Dollars in millions, except as noted 2011 2010
A
SSETS
U
NDER
A
DMINISTRATION
(in billions) (a) (d)
Personal $100 $99
Institutional 110 113
Total $210 $212
Asset Type
Equity $111 $115
Fixed Income 66 63
Liquidity/Other 33 34
Total $210 $212
Discretionary assets under management
Personal $69 $69
Institutional 38 39
Total $107 $108
Asset Type
Equity $53 $55
Fixed Income 38 36
Liquidity/Other 16 17
Total $107 $108
Nondiscretionary assets under administration
Personal $31 $30
Institutional 72 74
Total $103 $104
Asset Type
Equity $58 $60
Fixed Income 28 27
Liquidity/Other 17 17
Total $103 $104
(a) As of December 31.
(b) Includes nonperforming loans of $56 million at December 31, 2011 and $82 million
at December 31, 2010.
(c) Recorded investment of purchased impaired loans related to acquisitions.
(d) Excludes brokerage account assets.
Asset Management Group earned $141 million for 2011
compared with $137 million for 2010. Assets under
administration were $210 billion at December 31, 2011 and
$212 billion at December 31, 2010. Earnings for 2011
reflected a benefit from the provision for credit losses and
growth in noninterest income, partially offset by higher
noninterest expense and lower net interest income.
Noninterest expense increased due to continued strategic
investments in the business including front-line sales staff and
new client facing technology. The core growth strategies for
the business include: increasing channel penetration; investing
in higher growth geographies; and investing in differentiated
client-facing technology. For 2011, the business delivered
strong sales production, grew high value clients and benefited
from significant referrals from other PNC lines of business.
Over time and with stabilized market conditions, the
successful execution of these strategies and the accumulation
of our strong sales performance are expected to create
meaningful growth in assets under management and
noninterest income.
Highlights of Asset Management Group’s performance during
2011 include the following:
•Positive net flows in both discretionary assets under
management and total assets under administration;
• Strong sales production, up nearly 40% over the prior
year including a 26% increase in the acquisition of
new high value clients;
•Significant referrals from other PNC lines of business,
an increase of approximately 50% over 2010;
• Improved credit quality and performance;
• Continuing levels of new business investment and
focused hiring to drive growth with nearly 300
external new hires; and
• Roll-out of PNC Wealth InsightSM, our new online
client reporting tool.
Assets under administration were $210 billion at December 31,
2011 compared with $212 billion at December 31, 2010.
Discretionary assets under management were $107 billion at
December 31, 2011 compared with $108 billion at
December 31, 2010. The decrease in the comparisons was
driven by the exit of pension related assets and flat equity
markets on a comparative period end basis, offsetting strong
sales performance and successful client retention.
Total revenue for 2011 was $887 million compared with $884
million for 2010. Net interest income was $238 million for
2011 compared with $256 million for 2010. The decrease was
attributable to lower loan yields, lower loan balances and
lower interest credits assigned to deposits reflective of the
current low rate environment. Noninterest income was $649
million for 2011, up $21 million from the prior year due to
stronger average equity markets, increased sales and new
client acquisition. Noninterest income in the prior year
benefitted from approximately $19 million of tax, termination,
integration, and litigation related items that were not repeated
in 2011. Excluding these items in the comparison, total
noninterest income grew 6%.
Provision for credit losses was a benefit of $24 million for 2011
reflecting improved credit quality compared with provision of
$20 million for 2010. Net charge-offs were immaterial in 2011
as charge-off activity was mitigated by significant recoveries
compared with net charge-offs of $42 million in 2010.
Noninterest expense was $687 million in 2011, an increase of
$40 million or 6% from the prior year. The increase was
attributable to investments in the business to drive growth and
higher compensation-related costs. Asset Management Group
remains focused on disciplined expense management as it
invests in these strategic growth opportunities.
Average deposits of $7.8 billion for 2011 increased $601
million, or 8%, over the prior year. Average transaction
deposits grew 11% compared with 2010 and were partially
offset by the strategic run-off of higher rate certificates of
deposit in the comparison. Average loan balances of $6.1
58 The PNC Financial Services Group, Inc. – Form 10-K