PNC Bank 2011 Annual Report Download - page 144
Download and view the complete annual report
Please find page 144 of the 2011 PNC Bank annual report below. You can navigate through the pages in the report by either clicking on the pages listed below, or by using the keyword search tool below to find specific information within the annual report.-
 1
1 -
2
-
3
-
4
-
5
-
6
-
7
-
8
-
9
-
10
-
11
-
12
-
13
-
14
-
15
-
16
-
17
-
18
-
19
-
20
-
21
-
22
-
23
-
24
-
25
-
26
-
27
-
28
-
29
-
30
-
31
-
32
-
33
-
34
-
35
-
36
-
37
-
38
-
39
-
40
-
41
-
42
-
43
-
44
-
45
-
46
-
47
-
48
-
49
-
50
-
51
-
52
-
53
-
54
-
55
-
56
-
57
-
58
-
59
-
60
-
61
-
62
-
63
-
64
-
65
-
66
-
67
-
68
-
69
-
70
-
71
-
72
-
73
-
74
-
75
-
76
-
77
-
78
-
79
-
80
-
81
-
82
-
83
-
84
-
85
-
86
-
87
-
88
-
89
-
90
-
91
-
92
-
93
-
94
-
95
-
96
-
97
-
98
-
99
-
100
-
101
-
102
-
103
-
104
-
105
-
106
-
107
-
108
-
109
-
110
-
111
-
112
-
113
-
114
-
115
-
116
-
117
-
118
-
119
-
120
-
121
-
122
-
123
-
124
-
125
-
126
-
127
-
128
-
129
-
130
-
131
-
132
-
133
-
 134
134 -
 135
135 -
 136
136 -
 137
137 -
 138
138 -
 139
139 -
 140
140 -
 141
141 -
 142
142 -
 143
143 -
 144
144 -
 145
145 -
 146
146 -
 147
147 -
 148
148 -
 149
149 -
 150
150 -
 151
151 -
 152
152 -
 153
153 -
 154
154 -
155
-
156
-
157
-
158
-
159
-
160
-
161
-
162
-
163
-
164
-
165
-
166
-
167
-
168
-
169
-
170
-
171
-
172
-
173
-
174
-
175
-
176
-
177
-
178
-
179
-
180
-
181
-
182
-
183
-
184
-
185
-
186
-
187
-
188
-
189
-
190
-
191
-
192
-
193
-
194
-
195
-
196
-
197
-
198
-
199
-
200
-
201
-
202
-
203
-
204
-
205
-
206
-
207
-
208
-
209
-
210
-
211
-
212
-
213
-
214
-
215
-
216
-
217
-
218
-
219
-
220
-
221
-
222
-
223
-
224
-
225
-
226
-
227
-
228
-
229
-
230
-
231
-
232
-
233
-
234
-
235
-
236
-
237
-
238
 |
 |

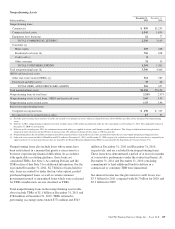
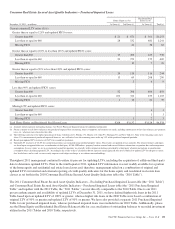
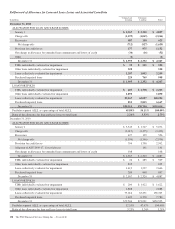
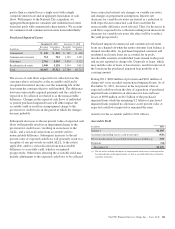
(a) At December 31, 2011, we had $49 million of credit card loans that are higher risk (i.e., loans with both updated FICO scores less than 660 and in late stage (90+ days) delinquency
status). The majority of the December 31, 2011 balance related to higher risk credit card loans is geographically distributed throughout the following areas: Ohio 20%, Michigan 14%,
Pennsylvania 13%, Illinois 7%, Indiana 7%, Florida 6%, and Kentucky 5%. All other states, none of which comprise more than 4%, make up the remainder of the balance. At
December 31, 2010, we had $70 million of credit card loans that are higher risk. The majority of the December 31, 2010 balance related to higher risk credit card loans is
geographically distributed throughout the following areas: Ohio 20%, Michigan 14%, Pennsylvania 14%, Illinois 8%, and Indiana 7%. All other states, none of which comprise more
than 5%, make up the remainder of the balance.
(b) Other consumer loans for which updated FICO scores are used as an asset quality indicator include non-government guaranteed or insured education loans, automobile loans and other
secured and unsecured lines and loans. Other consumer loans for which other internal credit metrics are used as an asset quality indicator include primarily government guaranteed or
insured education loans, as well as consumer loans to high net worth individuals. Other internal credit metrics may include delinquency status, geography or other factors.
(c) Credit card loans and other consumer loans with no FICO score available or required refers to new accounts issued to borrowers with limited credit history, accounts for which we
cannot obtain an updated FICO (e.g., recent profile changes), cards issued with a business name, and/or cards secured by collateral. Management proactively assesses the risk and size
of this loan portfolio and, when necessary, takes actions to mitigate the credit risk.
(d) Weighted-average updated FICO score excludes accounts with no FICO score available or required.
T
ROUBLED
D
EBT
R
ESTRUCTURINGS
(TDR
S
)
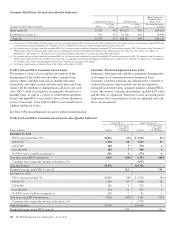
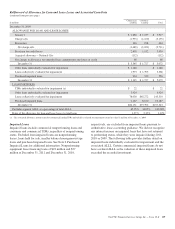
A TDR is a loan whose terms have been restructured in a
manner that grants a concession to a borrower experiencing
financial difficulties. TDRs typically result from our loss
mitigation activities and include rate reductions, principal
forgiveness, postponement/reduction of scheduled
amortization, and extensions, which are intended to minimize
economic loss and to avoid foreclosure or repossession of
collateral. In those situations where principal is forgiven, the
amount of such principal forgiveness is immediately charged
off.
Some TDRs may not ultimately result in the full collection of
principal and interest, as restructured, and result in potential
incremental losses. These potential incremental losses have
been factored into our overall ALLL estimate. The level of
any subsequent defaults will likely be affected by future
economic conditions. Once a loan becomes a TDR, it will
continue to be reported as a TDR until it is ultimately repaid
in full, the collateral is foreclosed upon, or it is fully charged
off. We held specific reserves in the ALLL of $580 million at
December 31, 2011 and $509 million at December 31, 2010
for the total TDR portfolio.
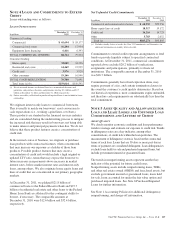
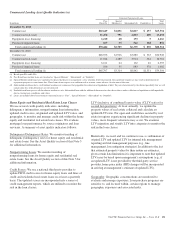
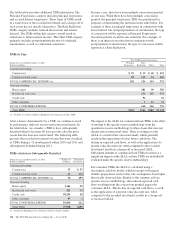
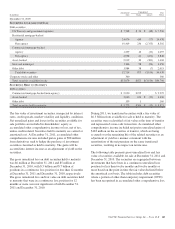
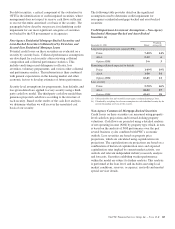
Summary of Troubled Debt Restructurings
In millions
Dec. 31
2011
Dec. 31
2010
Total consumer lending $1,798 $1,422
Total commercial lending 405 236
Total TDRs $2,203 $1,658
Nonperforming $1,141 $ 784
Accruing (a) 771 543
Credit card (b) 291 331
Total TDRs $2,203 $1,658
(a) Accruing loans have demonstrated a period of at least six months of performance
under the restructured terms and are excluded from nonperforming loans.
(b) Includes credit cards and certain small business and consumer credit agreements
whose terms have been restructured and are TDRs. However, since our policy is to
exempt these loans from being placed on nonaccrual status as permitted by
regulatory guidance as generally these loans are directly charged off in the period
that they become 180 days past due, these loans are excluded from nonperforming
loans.
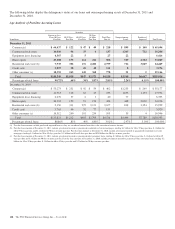
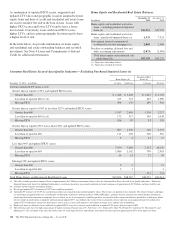
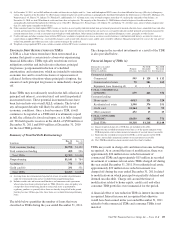
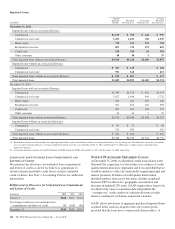
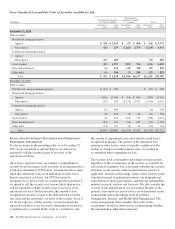
The table below quantifies the number of loans that were
classified as TDRs during the year ended December 31, 2011.
The change in the recorded investments as a result of the TDR
is also provided below.
Financial Impact of TDRs (a)
During the year ended
December 31, 2011
Dollars in millions
Number
of Loans
Pre-TDR
Recorded
Investment (b)
Post-TDR
Recorded
Investment (c)
Commercial lending
Commercial 599 $ 129 $ 112
Commercial real estate 78 286 260
Equipment lease financing (d) 21
TOTAL COMMERCIAL
LENDING 679 416 372
Consumer lending
Home equity 4,013 321 320
Residential real estate 1,590 376 351
Credit card 12,564 92 92
Other consumer 472 13 13
TOTAL CONSUMER
LENDING 18,639 802 776
Total TDRs 19,318 $1,218 $1,148
(a) Impact of partial charge offs at TDR date are included in this table.
(b) Represents the recorded investment of the loans as of the quarter end prior to the
TDR designation, and excludes immaterial amounts of accrued interest receivable.
(c) Represents the recorded investment of the TDRs as of the quarter end the TDR
occurs, and excludes immaterial amounts of accrued interest receivable.
(d) Post-TDR Recorded Investment amount totaled less than $1 million.
TDRs may result in charge-offs and interest income not being
recognized. At or around the time of modification, there was
approximately $26 million in recorded investment of
commercial TDRs and approximately $15 million in recorded
investment of commercial real estate TDRs charged off during
the year ended December 31, 2011. For residential real estate,
approximately $29 million in recorded investment was
charged off during the year ended December 31, 2011 related
to modifications in which principal was partially deferred and
deemed uncollectible. Charge offs around the time of
modification related to home equity, credit card, and other
consumer TDR portfolios were immaterial for the period.
A financial effect of rate reduction TDRs is interest income not
recognized. Interest income not recognized that otherwise
would have been earned in the year ended December 31, 2011
related to both commercial TDRs and consumer TDRs is not
material.
The PNC Financial Services Group, Inc. – Form 10-K 135