PNC Bank 2011 Annual Report Download - page 44
Download and view the complete annual report
Please find page 44 of the 2011 PNC Bank annual report below. You can navigate through the pages in the report by either clicking on the pages listed below, or by using the keyword search tool below to find specific information within the annual report.-
 1
1 -
2
-
3
-
4
-
5
-
6
-
7
-
8
-
9
-
10
-
11
-
12
-
13
-
14
-
15
-
16
-
17
-
18
-
19
-
20
-
21
-
22
-
23
-
24
-
25
-
26
-
27
-
28
-
29
-
30
-
31
-
32
-
33
-
 34
34 -
 35
35 -
 36
36 -
 37
37 -
 38
38 -
 39
39 -
 40
40 -
 41
41 -
 42
42 -
 43
43 -
 44
44 -
 45
45 -
 46
46 -
 47
47 -
 48
48 -
 49
49 -
 50
50 -
 51
51 -
 52
52 -
 53
53 -
 54
54 -
55
-
56
-
57
-
58
-
59
-
60
-
61
-
62
-
63
-
64
-
65
-
66
-
67
-
68
-
69
-
70
-
71
-
72
-
73
-
74
-
75
-
76
-
77
-
78
-
79
-
80
-
81
-
82
-
83
-
84
-
85
-
86
-
87
-
88
-
89
-
90
-
91
-
92
-
93
-
94
-
95
-
96
-
97
-
98
-
99
-
100
-
101
-
102
-
103
-
104
-
105
-
106
-
107
-
108
-
109
-
110
-
111
-
112
-
113
-
114
-
115
-
116
-
117
-
118
-
119
-
120
-
121
-
122
-
123
-
124
-
125
-
126
-
127
-
128
-
129
-
130
-
131
-
132
-
133
-
134
-
135
-
136
-
137
-
138
-
139
-
140
-
141
-
142
-
143
-
144
-
145
-
146
-
147
-
148
-
149
-
150
-
151
-
152
-
153
-
154
-
155
-
156
-
157
-
158
-
159
-
160
-
161
-
162
-
163
-
164
-
165
-
166
-
167
-
168
-
169
-
170
-
171
-
172
-
173
-
174
-
175
-
176
-
177
-
178
-
179
-
180
-
181
-
182
-
183
-
184
-
185
-
186
-
187
-
188
-
189
-
190
-
191
-
192
-
193
-
194
-
195
-
196
-
197
-
198
-
199
-
200
-
201
-
202
-
203
-
204
-
205
-
206
-
207
-
208
-
209
-
210
-
211
-
212
-
213
-
214
-
215
-
216
-
217
-
218
-
219
-
220
-
221
-
222
-
223
-
224
-
225
-
226
-
227
-
228
-
229
-
230
-
231
-
232
-
233
-
234
-
235
-
236
-
237
-
238
 |
 |

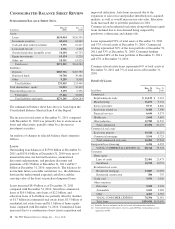
Corporate & Institutional Banking
Corporate & Institutional Banking earned $1.9 billion in 2011
and $1.8 billion in 2010. The increase in earnings was
primarily due to an improvement in the provision for credit
losses, which was a benefit in 2011, partially offset by a
reduction in the value of commercial mortgage servicing
rights and lower net interest income. We continued to focus on
adding new clients, increasing cross sales, and remaining
committed to strong expense discipline.
Asset Management Group
Asset Management Group earned $141 million for 2011
compared with $137 million for 2010. Assets under
administration were $210 billion at December 31, 2011 and
$212 billion at December 31, 2010. Earnings for 2011
reflected a benefit from the provision for credit losses and
growth in noninterest income, partially offset by higher
noninterest expense and lower net interest income. For 2011,
the business delivered strong sales production, grew high
value clients and benefitted from significant referrals from
other PNC lines of business. Over time and with stabilized
market conditions, the successful execution of these strategies
and the accumulation of our strong sales performance are
expected to create meaningful growth in assets under
management and noninterest income.
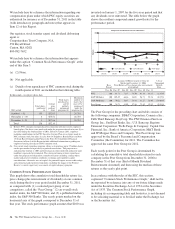
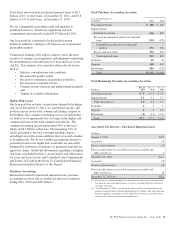
Residential Mortgage Banking
Residential Mortgage Banking earned $87 million in 2011
compared with $269 million in 2010. The decline in earnings
was driven by an increase in noninterest expense associated
with increased costs for residential mortgage foreclosure-
related expenses, primarily as a result of ongoing
governmental matters, and lower net interest income, partially
offset by an increase in loan originations and higher loans
sales revenue.
BlackRock
Our BlackRock business segment earned $361 million in 2011
and $351 million in 2010. The higher business segment
earnings from BlackRock for 2011 compared with 2010 were
primarily due to an increase in revenue.
Non-Strategic Assets Portfolio
This business segment (formerly Distressed Assets Portfolio)
consists primarily of acquired non-strategic assets that fall
outside of our core business strategy. Non-Strategic Assets
Portfolio had earnings of $200 million in 2011 compared with
a loss of $57 million in 2010. The increase was primarily
attributable to a lower provision for credit losses partially
offset by lower net interest income.
Other
“Other” reported earnings of $376 million for 2011 compared
with earnings of $386 million for 2010. The decrease in
earnings primarily reflected the noncash charge related to the
redemption of trust preferred securities in the fourth quarter of
2011 and the gain related to the sale of a portion of PNC’s
BlackRock shares in 2010 partially offset by lower integration
costs in 2011.
C
ONSOLIDATED
I
NCOME
S
TATEMENT
R
EVIEW
Our Consolidated Income Statement is presented in Item 8 of
this Report.
Net income for 2011 was $3.1 billion compared with $3.4
billion for 2010. Results for 2011 include the impact of $324
million of residential mortgage foreclosure-related expenses
primarily as a result of ongoing governmental matters, a $198
million noncash charge related to redemption of trust
preferred securities and $42 million for integration costs.
Results for 2010 included the $328 million after-tax gain on
our sale of GIS, $387 million for integration costs, and $71
million of residential mortgage foreclosure-related expenses.
For 2010, net income attributable to common shareholders
was also impacted by a noncash reduction of $250 million in
connection with the redemption of TARP preferred stock.
PNC’s results for 2011 were driven by good performance in a
challenging environment of low interest rates, slow economic
growth and new regulations.
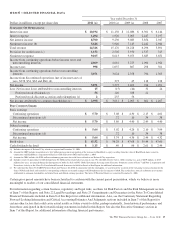
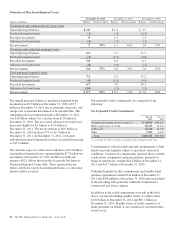
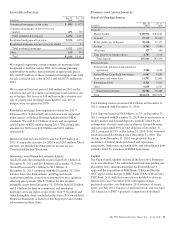
N
ET
I
NTEREST
I
NCOME AND
N
ET
I
NTEREST
M
ARGIN
Year ended December 31
Dollars in millions 2011 2010
Net interest income $8,700 $9,230
Net interest margin 3.92% 4.14%
Changes in net interest income and margin result from the
interaction of the volume and composition of interest-earning
assets and related yields, interest-bearing liabilities and related
rates paid, and noninterest-bearing sources of funding. See the
Statistical Information (Unaudited) – Analysis Of
Year-To-Year Changes In Net Interest Income and Average
Consolidated Balance Sheet And Net Interest Analysis in
Item 8 and the discussion of purchase accounting accretion in
the Consolidated Balance Sheet Review in Item 7 of this
Report for additional information.
The decreases in net interest income and net interest margin
for 2011 compared with 2010 were primarily attributable to a
decrease in purchase accounting accretion on purchased
impaired loans primarily due to lower excess cash recoveries.
A decline in average loan balances and the low interest rate
environment, partially offset by lower funding costs, also
contributed to the decrease.
The PNC Financial Services Group, Inc. – Form 10-K 35