PNC Bank 2011 Annual Report Download - page 4
Download and view the complete annual report
Please find page 4 of the 2011 PNC Bank annual report below. You can navigate through the pages in the report by either clicking on the pages listed below, or by using the keyword search tool below to find specific information within the annual report.-
 1
1 -
 2
2 -
 3
3 -
 4
4 -
 5
5 -
 6
6 -
 7
7 -
 8
8 -
 9
9 -
 10
10 -
 11
11 -
 12
12 -
 13
13 -
 14
14 -
 15
15 -
16
-
17
-
18
-
19
-
20
-
21
-
22
-
23
-
24
-
25
-
26
-
27
-
28
-
29
-
30
-
31
-
32
-
33
-
34
-
35
-
36
-
37
-
38
-
39
-
40
-
41
-
42
-
43
-
44
-
45
-
46
-
47
-
48
-
49
-
50
-
51
-
52
-
53
-
54
-
55
-
56
-
57
-
58
-
59
-
60
-
61
-
62
-
63
-
64
-
65
-
66
-
67
-
68
-
69
-
70
-
71
-
72
-
73
-
74
-
75
-
76
-
77
-
78
-
79
-
80
-
81
-
82
-
83
-
84
-
85
-
86
-
87
-
88
-
89
-
90
-
91
-
92
-
93
-
94
-
95
-
96
-
97
-
98
-
99
-
100
-
101
-
102
-
103
-
104
-
105
-
106
-
107
-
108
-
109
-
110
-
111
-
112
-
113
-
114
-
115
-
116
-
117
-
118
-
119
-
120
-
121
-
122
-
123
-
124
-
125
-
126
-
127
-
128
-
129
-
130
-
131
-
132
-
133
-
134
-
135
-
136
-
137
-
138
-
139
-
140
-
141
-
142
-
143
-
144
-
145
-
146
-
147
-
148
-
149
-
150
-
151
-
152
-
153
-
154
-
155
-
156
-
157
-
158
-
159
-
160
-
161
-
162
-
163
-
164
-
165
-
166
-
167
-
168
-
169
-
170
-
171
-
172
-
173
-
174
-
175
-
176
-
177
-
178
-
179
-
180
-
181
-
182
-
183
-
184
-
185
-
186
-
187
-
188
-
189
-
190
-
191
-
192
-
193
-
194
-
195
-
196
-
197
-
198
-
199
-
200
-
201
-
202
-
203
-
204
-
205
-
206
-
207
-
208
-
209
-
210
-
211
-
212
-
213
-
214
-
215
-
216
-
217
-
218
-
219
-
220
-
221
-
222
-
223
-
224
-
225
-
226
-
227
-
228
-
229
-
230
-
231
-
232
-
233
-
234
-
235
-
236
-
237
-
238
 |
 |

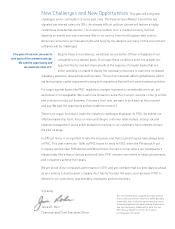
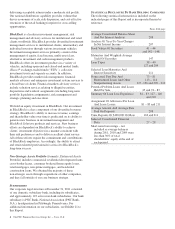
On a relative basis, PNC remains among the best capitalized banks in our peer group. At year end,
our Tier 1 common capital ratio was 10.3 percent, more than double what it was at the end of 2008.
That capital strength and earnings supported our decision to increase the common stock dividend
in the second quarter of 2011, a decision we were pleased to deliver to our shareholders.
Our future capital plans will depend on various factors, including the final
Basel III capital rules and the Federal Reserve’s ongoing requirements for
capital planning by large banks. While Basel III capital requirements are still
a long way from being fully phased in and a number of items are yet to be
resolved, we believe that we are very well positioned.
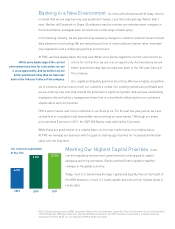
For 2012, we continue to focus on three capital priorities. First, we will build
capital to support our clients, increase customer relationships and invest in
our businesses. Second, we must maintain appropriate capital in light of global
economic uncertainty. Finally, we expect to return excess capital to shareholders
as appropriate, subject to regulatory approval.
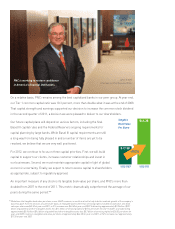
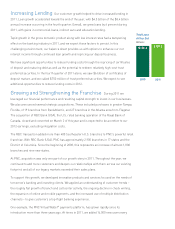
An important measure of any stock is its tangible book value per share, and PNC’s more than
doubled from 2007 to the end of 2011. This metric dramatically outperformed the average of our
peers during the same period.**
PNC is working to restore confidence
in America’s financial institutions.
James E. Rohr
Chairman and Chief Executive Officer
Tangible
Book Value
Per Share
$17.58
12/31/07 12/31/11
$44.38
+152%
** We believe that tangible book value per share, a non-GAAP measure, is useful as a tool to help to better evaluate growth of the company’s
business apart from the amount, on a per share basis, of intangible assets other than servicing rights included in book value. Our book
value per share was $61.52 at year-end 2011, a 41% increase over $43.60 at year-end 2007. Subtracting approximately $9.0 billion ($10.1
billion of goodwill and other intangible assets less $1.1 billion of servicing rights) or $17.14 per share for year-end 2011, and subtracting
approximately $8.9 billion ($9.6 billion of goodwill and other intangible assets less $0.7 billion of servicing rights) or $26.02 per share for
year-end 2007, results in a tangible book value per share of approximately $44.38 for year-end 2011, a 152% increase over approximately
$17.58 at year-end 2007.