PNC Bank 2011 Annual Report Download - page 50
Download and view the complete annual report
Please find page 50 of the 2011 PNC Bank annual report below. You can navigate through the pages in the report by either clicking on the pages listed below, or by using the keyword search tool below to find specific information within the annual report.-
 1
1 -
2
-
3
-
4
-
5
-
6
-
7
-
8
-
9
-
10
-
11
-
12
-
13
-
14
-
15
-
16
-
17
-
18
-
19
-
20
-
21
-
22
-
23
-
24
-
25
-
26
-
27
-
28
-
29
-
30
-
31
-
32
-
33
-
34
-
35
-
36
-
37
-
38
-
39
-
 40
40 -
 41
41 -
 42
42 -
 43
43 -
 44
44 -
 45
45 -
 46
46 -
 47
47 -
 48
48 -
 49
49 -
 50
50 -
 51
51 -
 52
52 -
 53
53 -
 54
54 -
 55
55 -
 56
56 -
 57
57 -
 58
58 -
 59
59 -
 60
60 -
61
-
62
-
63
-
64
-
65
-
66
-
67
-
68
-
69
-
70
-
71
-
72
-
73
-
74
-
75
-
76
-
77
-
78
-
79
-
80
-
81
-
82
-
83
-
84
-
85
-
86
-
87
-
88
-
89
-
90
-
91
-
92
-
93
-
94
-
95
-
96
-
97
-
98
-
99
-
100
-
101
-
102
-
103
-
104
-
105
-
106
-
107
-
108
-
109
-
110
-
111
-
112
-
113
-
114
-
115
-
116
-
117
-
118
-
119
-
120
-
121
-
122
-
123
-
124
-
125
-
126
-
127
-
128
-
129
-
130
-
131
-
132
-
133
-
134
-
135
-
136
-
137
-
138
-
139
-
140
-
141
-
142
-
143
-
144
-
145
-
146
-
147
-
148
-
149
-
150
-
151
-
152
-
153
-
154
-
155
-
156
-
157
-
158
-
159
-
160
-
161
-
162
-
163
-
164
-
165
-
166
-
167
-
168
-
169
-
170
-
171
-
172
-
173
-
174
-
175
-
176
-
177
-
178
-
179
-
180
-
181
-
182
-
183
-
184
-
185
-
186
-
187
-
188
-
189
-
190
-
191
-
192
-
193
-
194
-
195
-
196
-
197
-
198
-
199
-
200
-
201
-
202
-
203
-
204
-
205
-
206
-
207
-
208
-
209
-
210
-
211
-
212
-
213
-
214
-
215
-
216
-
217
-
218
-
219
-
220
-
221
-
222
-
223
-
224
-
225
-
226
-
227
-
228
-
229
-
230
-
231
-
232
-
233
-
234
-
235
-
236
-
237
-
238
 |
 |

I
NVESTMENT
S
ECURITIES
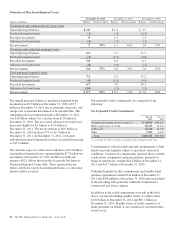
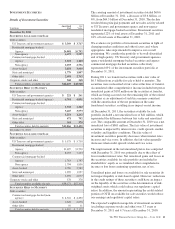
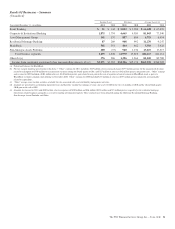
Details of Investment Securities
In millions
Amortized
Cost
Fair
Value
December 31, 2011
S
ECURITIES
A
VAILABLE FOR
S
ALE
Debt securities
US Treasury and government agencies $ 3,369 $ 3,717
Residential mortgage-backed
Agency 26,081 26,792
Non-agency 6,673 5,557
Commercial mortgage-backed
Agency 1,101 1,140
Non-agency 2,693 2,756
Asset-backed 3,854 3,669
State and municipal 1,779 1,807
Other debt 2,691 2,762
Corporate stocks and other 368 368
Total securities available for sale $48,609 $48,568
S
ECURITIES
H
ELD TO
M
ATURITY
Debt securities
US Treasury and government agencies $ 221 $ 261
Residential mortgage-backed (agency) 4,761 4,891
Commercial mortgage-backed
Agency 1,332 1,382
Non-agency 3,467 3,573
Asset-backed 1,251 1,262
State and municipal 671 702
Other debt 363 379
Total securities held to maturity $12,066 $12,450
December 31, 2010
S
ECURITIES
A
VAILABLE FOR
S
ALE
Debt securities
US Treasury and government agencies $ 5,575 $ 5,710
Residential mortgage-backed
Agency 31,697 31,720
Non-agency 8,193 7,233
Commercial mortgage-backed
Agency 1,763 1,797
Non-agency 1,794 1,856
Asset-backed 2,780 2,582
State and municipal 1,999 1,957
Other debt 3,992 4,077
Corporate stocks and other 378 378
Total securities available for sale $58,171 $57,310
S
ECURITIES
H
ELD TO
M
ATURITY
Debt securities
Commercial mortgage-backed (non-
agency) $ 4,316 $ 4,490
Asset-backed 2,626 2,676
Other debt 10 11
Total securities held to maturity $ 6,952 $ 7,177
The carrying amount of investment securities totaled $60.6
billion at December 31, 2011, a decrease of $3.6 billion, or
6%, from $64.3 billion at December 31, 2010. The decline
resulted from principal payments and net sales activity related
to US Treasury and government agency and non-agency
residential mortgage-backed securities. Investment securities
represented 22% of total assets at December 31, 2011 and
24% of total assets at December 31, 2010.
We evaluate our portfolio of investment securities in light of
changing market conditions and other factors and, where
appropriate, take steps intended to improve our overall
positioning. We consider the portfolio to be well-diversified
and of high quality. US Treasury and government agencies,
agency residential mortgage-backed securities and agency
commercial mortgage-backed securities collectively
represented 63% of the investment securities portfolio at
December 31, 2011.
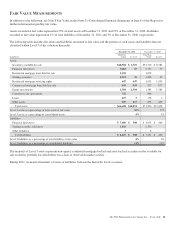
During 2011, we transferred securities with a fair value of
$6.3 billion from available for sale to held to maturity. The
securities were reclassified at fair value at the time of transfer.
Accumulated other comprehensive income included net pretax
unrealized gains of $183 million on the securities at transfer,
which are being accreted over the remaining life of the related
securities as an adjustment of yield in a manner consistent
with the amortization of the net premium on the same
transferred securities, resulting in no impact on net income.
At December 31, 2011, the securities available for sale
portfolio included a net unrealized loss of $41 million, which
represented the difference between fair value and amortized
cost. The comparable amount at December 31, 2010 was a net
unrealized loss of $861 million. The fair value of investment
securities is impacted by interest rates, credit spreads, market
volatility and liquidity conditions. The fair value of
investment securities generally decreases when interest rates
increase and vice versa. In addition, the fair value generally
decreases when credit spreads widen and vice versa.
The improvement in the net unrealized pretax loss compared
with December 31, 2010 was primarily due to the effect of
lower market interest rates. Net unrealized gains and losses in
the securities available for sale portfolio are included in
shareholders’ equity as accumulated other comprehensive
income or loss from continuing operations, net of tax.
Unrealized gains and losses on available for sale securities do
not impact liquidity or risk-based capital. However, reductions
in the credit ratings of these securities could have an impact
on the liquidity of the securities or the determination of risk-
weighted assets which could reduce our regulatory capital
ratios. In addition, the amount representing the credit-related
portion of OTTI on available for sale securities would reduce
our earnings and regulatory capital ratios.
The expected weighted-average life of investment securities
(excluding corporate stocks and other) was 3.7 years at
December 31, 2011 and 4.7 years at December 31, 2010.
The PNC Financial Services Group, Inc. – Form 10-K 41