PNC Bank 2011 Annual Report Download - page 60
Download and view the complete annual report
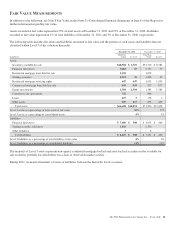
Please find page 60 of the 2011 PNC Bank annual report below. You can navigate through the pages in the report by either clicking on the pages listed below, or by using the keyword search tool below to find specific information within the annual report.-
 1
1 -
2
-
3
-
4
-
5
-
6
-
7
-
8
-
9
-
10
-
11
-
12
-
13
-
14
-
15
-
16
-
17
-
18
-
19
-
20
-
21
-
22
-
23
-
24
-
25
-
26
-
27
-
28
-
29
-
30
-
31
-
32
-
33
-
34
-
35
-
36
-
37
-
38
-
39
-
40
-
41
-
42
-
43
-
44
-
45
-
46
-
47
-
48
-
49
-
 50
50 -
 51
51 -
 52
52 -
 53
53 -
 54
54 -
 55
55 -
 56
56 -
 57
57 -
 58
58 -
 59
59 -
 60
60 -
 61
61 -
 62
62 -
 63
63 -
 64
64 -
 65
65 -
 66
66 -
 67
67 -
 68
68 -
 69
69 -
 70
70 -
71
-
72
-
73
-
74
-
75
-
76
-
77
-
78
-
79
-
80
-
81
-
82
-
83
-
84
-
85
-
86
-
87
-
88
-
89
-
90
-
91
-
92
-
93
-
94
-
95
-
96
-
97
-
98
-
99
-
100
-
101
-
102
-
103
-
104
-
105
-
106
-
107
-
108
-
109
-
110
-
111
-
112
-
113
-
114
-
115
-
116
-
117
-
118
-
119
-
120
-
121
-
122
-
123
-
124
-
125
-
126
-
127
-
128
-
129
-
130
-
131
-
132
-
133
-
134
-
135
-
136
-
137
-
138
-
139
-
140
-
141
-
142
-
143
-
144
-
145
-
146
-
147
-
148
-
149
-
150
-
151
-
152
-
153
-
154
-
155
-
156
-
157
-
158
-
159
-
160
-
161
-
162
-
163
-
164
-
165
-
166
-
167
-
168
-
169
-
170
-
171
-
172
-
173
-
174
-
175
-
176
-
177
-
178
-
179
-
180
-
181
-
182
-
183
-
184
-
185
-
186
-
187
-
188
-
189
-
190
-
191
-
192
-
193
-
194
-
195
-
196
-
197
-
198
-
199
-
200
-
201
-
202
-
203
-
204
-
205
-
206
-
207
-
208
-
209
-
210
-
211
-
212
-
213
-
214
-
215
-
216
-
217
-
218
-
219
-
220
-
221
-
222
-
223
-
224
-
225
-
226
-
227
-
228
-
229
-
230
-
231
-
232
-
233
-
234
-
235
-
236
-
237
-
238
 |
 |

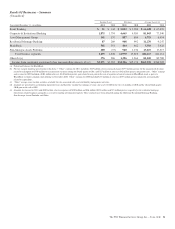
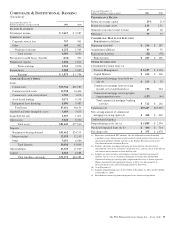
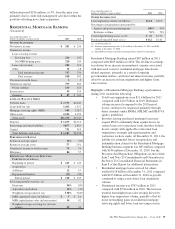
Results Of Businesses – Summary
(Unaudited)
Income (Loss) Revenue Average Assets (a)
Year ended December 31 - in millions 2011 2010 2011 2010 2011 2010
Retail Banking $31$ 144 $ 5,042 $ 5,386 $ 66,448 $ 67,428
Corporate & Institutional Banking 1,875 1,794 4,669 4,950 81,043 77,540
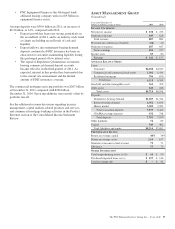
Asset Management Group 141 137 887 884 6,719 6,954
Residential Mortgage Banking 87 269 948 992 11,270 9,247
BlackRock 361 351 464 462 5,516 5,428
Non-Strategic Assets Portfolio 200 (57) 960 1,136 13,119 17,517
Total business segments 2,695 2,638 12,970 13,810 184,115 184,114
Other (b) (c) 376 386 1,356 1,366 81,220 80,788
Income from continuing operations before noncontrolling interests (d) (e) $3,071 $3,024 $14,326 $15,176 $265,335 $264,902
(a) Period-end balances for BlackRock.
(b) For our segment reporting presentation in this Item 7, “Other” earnings for 2011 included a $129 million after-tax noncash charge ($198 million pretax) for the unamortized discount
related to redemption of $750 million of trust preferred securities during the fourth quarter of 2011 and $27 million of after-tax ($42 million pretax) integration costs. “Other” earnings
and revenue for 2010 included a $102 million after-tax ($160 million pretax) gain related to our gain on the sale of a portion of our investment in BlackRock stock as part of a
BlackRock secondary common stock offering in November 2010. “Other” earnings for 2010 included $251 million of after-tax ($387 million pretax) integration costs primarily
related to acquisitions.
(c) “Other” average assets include securities available for sale associated with asset and liability management activities.
(d) Amounts are presented on a continuing operations basis and therefore exclude the earnings, revenue, and assets of GIS for the first six months of 2010 and the related third quarter
2010 gain on the sale of GIS.
(e) Amounts for income for 2011 and 2010 include after-tax expenses of $210 million and $46 million ($324 million and $71 million pretax, respectively) for residential mortgage
foreclosure-related expenses, primarily as a result of ongoing governmental matters. These amounts have been allocated among the following: Residential Mortgage Banking,
Non-Strategic Assets Portfolio, and Other.
The PNC Financial Services Group, Inc. – Form 10-K 51