PNC Bank 2011 Annual Report Download - page 211
Download and view the complete annual report
Please find page 211 of the 2011 PNC Bank annual report below. You can navigate through the pages in the report by either clicking on the pages listed below, or by using the keyword search tool below to find specific information within the annual report.-
 1
1 -
2
-
3
-
4
-
5
-
6
-
7
-
8
-
9
-
10
-
11
-
12
-
13
-
14
-
15
-
16
-
17
-
18
-
19
-
20
-
21
-
22
-
23
-
24
-
25
-
26
-
27
-
28
-
29
-
30
-
31
-
32
-
33
-
34
-
35
-
36
-
37
-
38
-
39
-
40
-
41
-
42
-
43
-
44
-
45
-
46
-
47
-
48
-
49
-
50
-
51
-
52
-
53
-
54
-
55
-
56
-
57
-
58
-
59
-
60
-
61
-
62
-
63
-
64
-
65
-
66
-
67
-
68
-
69
-
70
-
71
-
72
-
73
-
74
-
75
-
76
-
77
-
78
-
79
-
80
-
81
-
82
-
83
-
84
-
85
-
86
-
87
-
88
-
89
-
90
-
91
-
92
-
93
-
94
-
95
-
96
-
97
-
98
-
99
-
100
-
101
-
102
-
103
-
104
-
105
-
106
-
107
-
108
-
109
-
110
-
111
-
112
-
113
-
114
-
115
-
116
-
117
-
118
-
119
-
120
-
121
-
122
-
123
-
124
-
125
-
126
-
127
-
128
-
129
-
130
-
131
-
132
-
133
-
134
-
135
-
136
-
137
-
138
-
139
-
140
-
141
-
142
-
143
-
144
-
145
-
146
-
147
-
148
-
149
-
150
-
151
-
152
-
153
-
154
-
155
-
156
-
157
-
158
-
159
-
160
-
161
-
162
-
163
-
164
-
165
-
166
-
167
-
168
-
169
-
170
-
171
-
172
-
173
-
174
-
175
-
176
-
177
-
178
-
179
-
180
-
181
-
182
-
183
-
184
-
185
-
186
-
187
-
188
-
189
-
190
-
191
-
192
-
193
-
194
-
195
-
196
-
197
-
198
-
199
-
200
-
 201
201 -
 202
202 -
 203
203 -
 204
204 -
 205
205 -
 206
206 -
 207
207 -
 208
208 -
 209
209 -
 210
210 -
 211
211 -
 212
212 -
 213
213 -
 214
214 -
 215
215 -
 216
216 -
 217
217 -
 218
218 -
 219
219 -
 220
220 -
 221
221 -
222
-
223
-
224
-
225
-
226
-
227
-
228
-
229
-
230
-
231
-
232
-
233
-
234
-
235
-
236
-
237
-
238
 |
 |

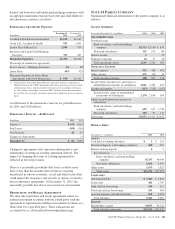
Commercial paper and all other debt issued by PNC Funding
Corp, a wholly owned finance subsidiary, is fully and
unconditionally guaranteed by the parent company. In
addition, in connection with certain affiliates’ commercial and
residential mortgage servicing operations, the parent company
has committed to maintain such affiliates’ net worth above
minimum requirements.
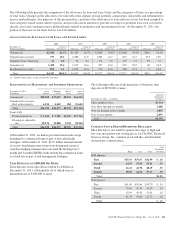
The Parent Company Balance Sheet at December 31, 2010
reflects a $250 million revision to correct deposits with a
banking subsidiary that was previously reported as Cash and
due from banks and is now reported as Restricted deposits
with banking subsidiary. This change in classification has also
been reflected in the Parent Company Statement of Cash
Flows as presented below. Management believes that the
impact of this misstatement and correction is not material.
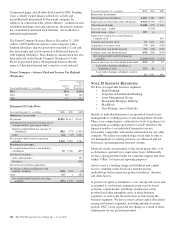
Parent Company – Interest Paid and Income Tax Refunds
(Payments)
Year ended December 31 - in millions
Interest
Paid
Income
Tax
Refunds /
(Payments)
2011 $361 $(130)
2010 419 342
2009 427 137
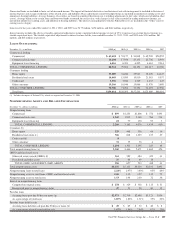
Statement Of Cash Flows
Year ended December 31 - in millions 2011 2010 2009
O
PERATING
A
CTIVITIES
Net income $3,056 $3,412 $2,447
Adjustments to reconcile net income to net
cash provided by operating activities:
Equity in undistributed net earnings of
subsidiaries (882) (774) (1,853)
Other (24) (53) 2,687
Net cash provided (used) by operating
activities 2,150 2,585 3,281
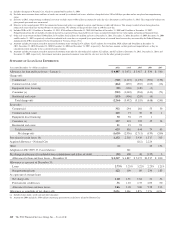
I
NVESTING
A
CTIVITIES
Net capital returned from (contributed to)
subsidiaries 50 1,766 (899)
Investment securities:
Sales and maturities 267
Purchases (228)
Net cash received from acquisitions 5
Net change in Restricted deposits with
banking subsidiary (150) (232) (8)
Other (35) 1 (182)
Net cash provided (used) by investing
activities (135) 1,535 (1,045)
Year ended December 31 - in millions 2011 2010 2009
F
INANCING
A
CTIVITIES
Borrowings from subsidiaries 4,660 7,580 3,420
Repayments on borrowings from subsidiaries (4,962) (6,596) (4,274)
Other borrowed funds (2,188) (379) (1,166)
Preferred stock – TARP (7,579)
Preferred stock – Other 987 (1)
Supervisory Capital Assessment Program –
common stock 624
Common and treasury stock 72 3,474 247
Acquisition of treasury stock (73) (204) (188)
Preferred stock cash dividends paid (56) (146) (388)
Common stock cash dividends paid (604) (204) (430)
Net cash provided (used) by financing
activities (2,164) (4,055) (2,155)
Increase (decrease) in cash and due from banks (149) 65 81
Cash held at banking subsidiary at
beginning of year 151 86 5
Cash held at banking subsidiary at end of
year $2 $151 $86
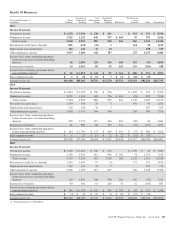
N
OTE
25 S
EGMENT
R
EPORTING
We have six reportable business segments:
• Retail Banking
• Corporate & Institutional Banking
• Asset Management Group
• Residential Mortgage Banking
• BlackRock
• Non-Strategic Assets Portfolio
Results of individual businesses are presented based on our
management accounting practices and management structure.
There is no comprehensive, authoritative body of guidance for
management accounting equivalent to GAAP; therefore, the
financial results of our individual businesses are not
necessarily comparable with similar information for any other
company. We refine our methodologies from time to time as
our management accounting practices are enhanced and our
businesses and management structure change.
Financial results are presented, to the extent practicable, as if
each business operated on a stand-alone basis. Additionally,
we have aggregated the results for corporate support functions
within “Other” for financial reporting purposes.
Assets receive a funding charge and liabilities and capital
receive a funding credit based on a transfer pricing
methodology that incorporates product maturities, duration
and other factors.
A portion of capital is intended to cover unexpected losses and
is assigned to our business segments using our risk-based
economic capital model, including consideration of the
goodwill and other intangible assets at those business
segments, as well as the diversification of risk among the
business segments. We have revised certain capital allocations
among our business segments, including amounts for prior
periods. PNC’s total capital did not change as a result of these
adjustments for any periods presented.
202 The PNC Financial Services Group, Inc. – Form 10-K