PNC Bank 2011 Annual Report Download - page 103
Download and view the complete annual report
Please find page 103 of the 2011 PNC Bank annual report below. You can navigate through the pages in the report by either clicking on the pages listed below, or by using the keyword search tool below to find specific information within the annual report.-
 1
1 -
2
-
3
-
4
-
5
-
6
-
7
-
8
-
9
-
10
-
11
-
12
-
13
-
14
-
15
-
16
-
17
-
18
-
19
-
20
-
21
-
22
-
23
-
24
-
25
-
26
-
27
-
28
-
29
-
30
-
31
-
32
-
33
-
34
-
35
-
36
-
37
-
38
-
39
-
40
-
41
-
42
-
43
-
44
-
45
-
46
-
47
-
48
-
49
-
50
-
51
-
52
-
53
-
54
-
55
-
56
-
57
-
58
-
59
-
60
-
61
-
62
-
63
-
64
-
65
-
66
-
67
-
68
-
69
-
70
-
71
-
72
-
73
-
74
-
75
-
76
-
77
-
78
-
79
-
80
-
81
-
82
-
83
-
84
-
85
-
86
-
87
-
88
-
89
-
90
-
91
-
92
-
 93
93 -
 94
94 -
 95
95 -
 96
96 -
 97
97 -
 98
98 -
 99
99 -
 100
100 -
 101
101 -
 102
102 -
 103
103 -
 104
104 -
 105
105 -
 106
106 -
 107
107 -
 108
108 -
 109
109 -
 110
110 -
 111
111 -
 112
112 -
 113
113 -
114
-
115
-
116
-
117
-
118
-
119
-
120
-
121
-
122
-
123
-
124
-
125
-
126
-
127
-
128
-
129
-
130
-
131
-
132
-
133
-
134
-
135
-
136
-
137
-
138
-
139
-
140
-
141
-
142
-
143
-
144
-
145
-
146
-
147
-
148
-
149
-
150
-
151
-
152
-
153
-
154
-
155
-
156
-
157
-
158
-
159
-
160
-
161
-
162
-
163
-
164
-
165
-
166
-
167
-
168
-
169
-
170
-
171
-
172
-
173
-
174
-
175
-
176
-
177
-
178
-
179
-
180
-
181
-
182
-
183
-
184
-
185
-
186
-
187
-
188
-
189
-
190
-
191
-
192
-
193
-
194
-
195
-
196
-
197
-
198
-
199
-
200
-
201
-
202
-
203
-
204
-
205
-
206
-
207
-
208
-
209
-
210
-
211
-
212
-
213
-
214
-
215
-
216
-
217
-
218
-
219
-
220
-
221
-
222
-
223
-
224
-
225
-
226
-
227
-
228
-
229
-
230
-
231
-
232
-
233
-
234
-
235
-
236
-
237
-
238
 |
 |
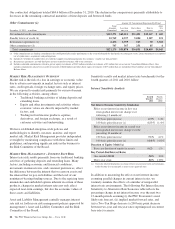
National City integration costs included in noninterest expense
totaled $387 million in 2010 and $421 million in 2009. We
achieved National City acquisition cost savings of $1.8 billion
on an annualized basis in the fourth quarter of 2010 through
the reduction of operational and administrative redundancies.
This amount was higher than our original goal of $1.2 billion,
and ahead of schedule. During 2010, we completed the
customer and branch conversions to our technology platforms
and integrated the businesses and operations of National City
with those of PNC.
Effective Tax Rate
Our effective tax rate was 25.5% for 2010 and 26.9% for
2009.
C
ONSOLIDATED
B
ALANCE
S
HEET
R
EVIEW
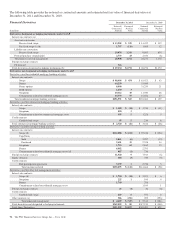
Loans
Loans decreased $6.9 billion, or 4%, to $150.6 billion as of
December 31, 2010 compared with December 31, 2009. An
increase in loans of $3.5 billion from the initial consolidation
of Market Street and the securitized credit card portfolio
effective January 1, 2010 was more than offset by the impact
of soft customer loan demand combined with loan repayments
and payoffs in the portfolio.
Loans represented 57% of total assets at December 31, 2010
and 58% at December 31, 2009. Commercial lending
represented 53% of the loan portfolio and consumer lending
represented 47% at both December 31, 2010 and
December 31, 2009. Commercial real estate loans represented
7% of total assets at December 31, 2010 and 9% of total assets
at December 31, 2009.
Investment Securities
The carrying amount of investment securities totaled $64.3
billion at December 31, 2010, an increase of $8.3 billion, or
15%, from $56.0 billion at December 31, 2009. The increase
in investment securities primarily reflected an increase in
securities available for sale as excess liquidity was invested in
short duration, high quality securities. Investment securities
represented 24% of total assets at December 31, 2010 and
21% at December 31, 2009.
In March 2010, we transferred $2.2 billion of available for
sale commercial mortgage-backed non-agency securities to
the held to maturity portfolio. The transfer involved high
quality securities where management’s intent to hold changed.
At December 31, 2010, the securities available for sale
portfolio included a net unrealized loss of $861 million, which
represented the difference between fair value and amortized
cost. The comparable amount at December 31, 2009 was a net
unrealized loss of $2.3 billion. The expected weighted-average
life of investment securities (excluding corporate stocks and
other) was 4.7 years at December 31, 2010 and 4.1 years at
December 31, 2009.
Loans Held For Sale
Loans held for sale totaled $3.5 billion at December 31, 2010
compared with $2.5 billion at December 31, 2009. We stopped
originating certain commercial mortgage loans designated as
held for sale during the first quarter of 2008 and continue
pursuing opportunities to reduce these positions at appropriate
prices. We sold $241 million of commercial mortgage loans
held for sale carried at fair value in 2010 and sold $272
million in 2009.
Residential mortgage loan origination volume was $10.5
billion in 2010. Substantially all such loans were originated
under agency or Federal Housing Administration (FHA)
standards. We sold $10.0 billion of loans and recognized
related gains of $231 million during 2010. The comparable
amounts for 2009 were $19.8 billion and $435 million,
respectively.
Asset Quality
Nonperforming assets decreased $1.1 billion to $5.1 billion at
December 31, 2010 compared with $6.2 billion at
December 31, 2009. Nonperforming loans decreased $1.2
billion to $4.5 billion since December 31, 2009 while OREO
and foreclosed assets increased $124 million to $657 million.
The decrease in nonperforming loans was primarily due to
improvements in our commercial lending and residential real
estate portfolios, partially offset by increases in our consumer
home equity portfolio. These consumer home equity
nonperforming loan increases were largely due to increases in
troubled debt restructurings (TDRs).
At December 31, 2010, our largest nonperforming asset was
$35 million in the Accommodation and Food Services
Industry and our average nonperforming loan associated with
commercial lending was approximately $1 million.
Goodwill and Other Intangible Assets
Goodwill and other intangible assets totaled $10.8 billion at
December 31, 2010 compared with $12.9 billion at December,
31, 2009. Goodwill declined $1.4 billion, to $8.1 billion, at
December 31, 2010 compared with the December 31, 2009
balance primarily due to the sale of GIS which reduced
goodwill by $1.2 billion. The $.8 billion decline in other
intangible assets from December 31, 2009 included $.3 billion
declines in both commercial and residential mortgage
servicing rights due primarily to the sale of commercial
mortgage servicing rights and residential mortgage servicing
rights value changes resulting primarily from market-driven
changes in interest rates.
Funding Sources
Total funding sources were $222.9 billion at December 31,
2010 and $226.2 billion at December 31, 2009. Funding
sources decreased $3.3 billion, primarily driven by declines in
retail certificates of deposit and Federal Home Loan Bank
borrowings, partially offset by increases in demand deposits
and other borrowings.
94 The PNC Financial Services Group, Inc. – Form 10-K