PNC Bank 2011 Annual Report Download - page 48
Download and view the complete annual report
Please find page 48 of the 2011 PNC Bank annual report below. You can navigate through the pages in the report by either clicking on the pages listed below, or by using the keyword search tool below to find specific information within the annual report.-
 1
1 -
2
-
3
-
4
-
5
-
6
-
7
-
8
-
9
-
10
-
11
-
12
-
13
-
14
-
15
-
16
-
17
-
18
-
19
-
20
-
21
-
22
-
23
-
24
-
25
-
26
-
27
-
28
-
29
-
30
-
31
-
32
-
33
-
34
-
35
-
36
-
37
-
 38
38 -
 39
39 -
 40
40 -
 41
41 -
 42
42 -
 43
43 -
 44
44 -
 45
45 -
 46
46 -
 47
47 -
 48
48 -
 49
49 -
 50
50 -
 51
51 -
 52
52 -
 53
53 -
 54
54 -
 55
55 -
 56
56 -
 57
57 -
 58
58 -
59
-
60
-
61
-
62
-
63
-
64
-
65
-
66
-
67
-
68
-
69
-
70
-
71
-
72
-
73
-
74
-
75
-
76
-
77
-
78
-
79
-
80
-
81
-
82
-
83
-
84
-
85
-
86
-
87
-
88
-
89
-
90
-
91
-
92
-
93
-
94
-
95
-
96
-
97
-
98
-
99
-
100
-
101
-
102
-
103
-
104
-
105
-
106
-
107
-
108
-
109
-
110
-
111
-
112
-
113
-
114
-
115
-
116
-
117
-
118
-
119
-
120
-
121
-
122
-
123
-
124
-
125
-
126
-
127
-
128
-
129
-
130
-
131
-
132
-
133
-
134
-
135
-
136
-
137
-
138
-
139
-
140
-
141
-
142
-
143
-
144
-
145
-
146
-
147
-
148
-
149
-
150
-
151
-
152
-
153
-
154
-
155
-
156
-
157
-
158
-
159
-
160
-
161
-
162
-
163
-
164
-
165
-
166
-
167
-
168
-
169
-
170
-
171
-
172
-
173
-
174
-
175
-
176
-
177
-
178
-
179
-
180
-
181
-
182
-
183
-
184
-
185
-
186
-
187
-
188
-
189
-
190
-
191
-
192
-
193
-
194
-
195
-
196
-
197
-
198
-
199
-
200
-
201
-
202
-
203
-
204
-
205
-
206
-
207
-
208
-
209
-
210
-
211
-
212
-
213
-
214
-
215
-
216
-
217
-
218
-
219
-
220
-
221
-
222
-
223
-
224
-
225
-
226
-
227
-
228
-
229
-
230
-
231
-
232
-
233
-
234
-
235
-
236
-
237
-
238
 |
 |

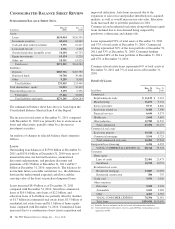
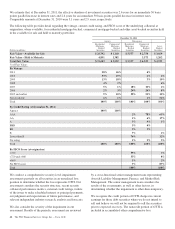
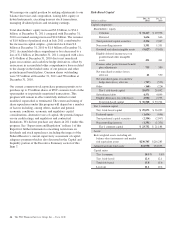
Total loans above include purchased impaired loans of $6.7
billion, or 4% of total loans, at December 31, 2011, and $7.8
billion, or 5% of total loans, at December 31, 2010.
We are committed to providing credit and liquidity to
qualified borrowers. Total loan originations and new
commitments and renewals totaled $147 billion for 2011.
Our loan portfolio continued to be diversified among
numerous industries and types of businesses in our principal
geographic markets.
Commercial lending is the largest category and is the most
sensitive to changes in assumptions and judgments underlying
the determination of the allowance for loan and lease losses
(ALLL). This estimate also considers other relevant factors
such as:
• Industry concentrations and conditions,
• Recent credit quality trends,
• Recent loss experience in particular portfolios,
• Recent macro economic factors,
• Changes in risk selection and underwriting standards,
and
• Timing of available information.
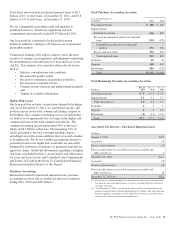
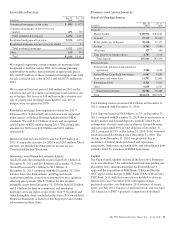
Higher Risk Loans
Our loan portfolio includes certain loans deemed to be higher
risk. As of December 31, 2011, we established specific and
pooled reserves on the total commercial lending category of
$2.0 billion. This commercial lending reserve included what
we believe to be appropriate loss coverage on the higher risk
commercial loans in the total commercial portfolio. The
commercial lending reserve represented 46% of the total
ALLL of $4.3 billion at that date. The remaining 54% of
ALLL pertained to the total consumer lending category,
including loans with certain attributes that we would consider
to be higher risk. We do not consider government insured or
guaranteed loans to be higher risk as defaults are materially
mitigated by payments of insurance or guarantee amounts for
approved claims. Additional information regarding our higher
risk loans is included in Note 5 Asset Quality and Allowances
for Loan and Lease Losses and Unfunded Loan Commitments
and Letters of Credit in the Notes To Consolidated Financial
Statements included in Item 8 of this Report.
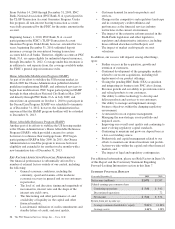
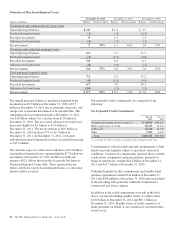
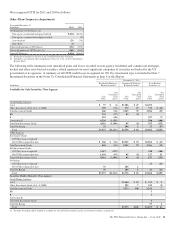
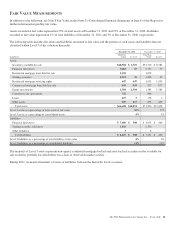
Purchase Accounting
Information related to purchased impaired loans, purchase
accounting accretion and accretable net interest recognized
during 2011, 2010 and 2009 follows.
Total Purchase Accounting Accretion
Year ended December 31
In millions 2011 2010
Non-impaired loans $ 288 $ 366
Impaired loans
Scheduled accretion 666 885
Reversal of contractual interest on impaired
loans (395) (529)
Scheduled accretion net of contractual
interest 271 356
Excess cash recoveries 254 483
Total impaired loans 525 839
Securities 49 54
Deposits 358 545
Borrowings (101) (155)
Total $1,119 $1,649
Total Remaining Purchase Accounting Accretion
In billions
Dec. 31
2011
Dec. 31
2010
Dec. 31
2009
Non-impaired loans $.9 $ 1.2 $ 1.6
Impaired loans 2.1 2.2 3.5
Total loans (gross) 3.0 3.4 5.1
Securities .4 .5 .5
Deposits .1 .5 1.0
Borrowings (.8) (1.1) (1.2)
Total $2.7 $ 3.3 $ 5.4
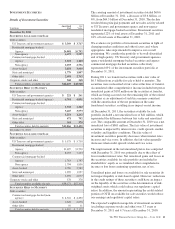
Accretable Net Interest – Purchased Impaired Loans
In billions
January 1, 2010 $3.5
Accretion (.9)
Excess cash recoveries (.5)
Net reclassifications to accretable from non-accretable and
other activity (a) .1
December 31, 2010 $2.2
Accretion (.7)
Excess cash recoveries (.2)
Net reclassifications to accretable from non-accretable and
other activity (a) .8
December 31, 2011 (b) $2.1
(a) The net reclass includes the impact of improvements in the excess cash expected to
be collected from credit improvements, as well as accretable differences related to
cash flow extensions.
(b) As of December 31, 2011, we estimate that the reversal of contractual interest on
purchased impaired loans will total approximately $1.4 billion. This will reduce the
benefit of purchase accounting accretion and offset the total net accretable interest
income of $2.1 billion on purchased impaired loans.
The PNC Financial Services Group, Inc. – Form 10-K 39