PNC Bank 2011 Annual Report Download - page 104
Download and view the complete annual report
Please find page 104 of the 2011 PNC Bank annual report below. You can navigate through the pages in the report by either clicking on the pages listed below, or by using the keyword search tool below to find specific information within the annual report.-
 1
1 -
2
-
3
-
4
-
5
-
6
-
7
-
8
-
9
-
10
-
11
-
12
-
13
-
14
-
15
-
16
-
17
-
18
-
19
-
20
-
21
-
22
-
23
-
24
-
25
-
26
-
27
-
28
-
29
-
30
-
31
-
32
-
33
-
34
-
35
-
36
-
37
-
38
-
39
-
40
-
41
-
42
-
43
-
44
-
45
-
46
-
47
-
48
-
49
-
50
-
51
-
52
-
53
-
54
-
55
-
56
-
57
-
58
-
59
-
60
-
61
-
62
-
63
-
64
-
65
-
66
-
67
-
68
-
69
-
70
-
71
-
72
-
73
-
74
-
75
-
76
-
77
-
78
-
79
-
80
-
81
-
82
-
83
-
84
-
85
-
86
-
87
-
88
-
89
-
90
-
91
-
92
-
93
-
 94
94 -
 95
95 -
 96
96 -
 97
97 -
 98
98 -
 99
99 -
 100
100 -
 101
101 -
 102
102 -
 103
103 -
 104
104 -
 105
105 -
 106
106 -
 107
107 -
 108
108 -
 109
109 -
 110
110 -
 111
111 -
 112
112 -
 113
113 -
 114
114 -
115
-
116
-
117
-
118
-
119
-
120
-
121
-
122
-
123
-
124
-
125
-
126
-
127
-
128
-
129
-
130
-
131
-
132
-
133
-
134
-
135
-
136
-
137
-
138
-
139
-
140
-
141
-
142
-
143
-
144
-
145
-
146
-
147
-
148
-
149
-
150
-
151
-
152
-
153
-
154
-
155
-
156
-
157
-
158
-
159
-
160
-
161
-
162
-
163
-
164
-
165
-
166
-
167
-
168
-
169
-
170
-
171
-
172
-
173
-
174
-
175
-
176
-
177
-
178
-
179
-
180
-
181
-
182
-
183
-
184
-
185
-
186
-
187
-
188
-
189
-
190
-
191
-
192
-
193
-
194
-
195
-
196
-
197
-
198
-
199
-
200
-
201
-
202
-
203
-
204
-
205
-
206
-
207
-
208
-
209
-
210
-
211
-
212
-
213
-
214
-
215
-
216
-
217
-
218
-
219
-
220
-
221
-
222
-
223
-
224
-
225
-
226
-
227
-
228
-
229
-
230
-
231
-
232
-
233
-
234
-
235
-
236
-
237
-
238
 |
 |

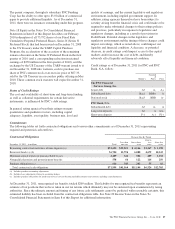
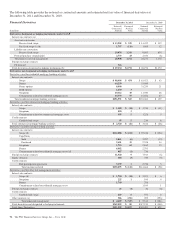
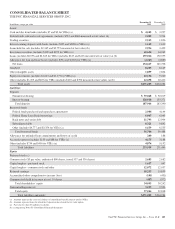
Total deposits decreased $3.5 billion at December 31, 2010
compared with December 31, 2009. Deposits decreased in the
comparison primarily due to declines in retail certificates of
deposit, time deposits in foreign offices and money market
deposits, partially offset by an increase in demand deposits.
Total borrowed funds increased $.2 billion to $39.5 billion at
December 31, 2010 compared to December 31, 2009. Other
borrowed funds increased in the comparison primarily due to
the consolidation of Market Street and a credit card
securitization trust. Additionally, bank notes and senior debt
increased since December 31, 2009 due to net issuances.
These increases were partially offset in the comparison by a
decline of Federal Home Loan Bank borrowings.
PNC issued $3.25 billion of senior notes in 2010. In March
2009, PNC issued $1.0 billion of floating rate senior notes
guaranteed by the FDIC under the FDIC’s TLGP-Debt
Guarantee Program (TLGP). In addition, PNC issued
$1.5 billion of senior notes during the second and third
quarters of 2009 that were not issued under the TLGP.
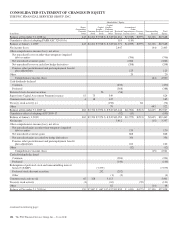
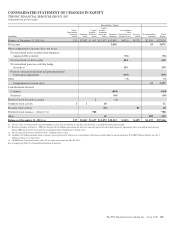
Shareholders’ Equity
Total shareholders’ equity increased $.3 billion, to $30.2
billion, at December 31, 2010 compared with December 31,
2009 and included the impact of the following:
• The first quarter 2010 issuance of 63.9 million shares
of common stock in an underwritten offering at $54
per share resulted in a $3.4 billion increase in total
shareholders’ equity,
• An increase of $2.7 billion to retained earnings, and
• A $1.5 billion decline in accumulated other
comprehensive loss largely due to decreases in net
unrealized securities losses.
The factors above were mostly offset by a decline of $7.3
billion in capital surplus-preferred stock in connection with
our February 2010 redemption of the Series N (TARP)
Preferred Stock as explained further in Note 18 Equity in the
Notes To Consolidated Financial Statements in Item 8 of this
Report.
Regulatory capital ratios at December 31, 2010 were 10.2%
for leverage, 12.1% for Tier 1 risk-based and 15.6% for total
risk-based capital. At December 31, 2009, the regulatory
capital ratios were 10.1% for leverage, 11.4% for Tier 1 risk-
based and 15.0% for total risk-based capital. The increase in
Tier 1 risk-based capital was attributable to retention of
earnings in 2010, the first quarter 2010 equity offering, the
third quarter 2010 sale of GIS, and lower risk-weighted assets.
G
LOSSARY
O
F
T
ERMS
Accretable net interest (Accretable yield) – The excess of cash
flows expected to be collected on a purchased impaired loan
over the carrying value of the loan. The accretable net interest
is recognized into interest income over the remaining life of
the loan using the constant effective yield method.
Adjusted average total assets – Primarily comprised of total
average quarterly (or annual) assets plus (less) unrealized
losses (gains) on investment securities, less goodwill and
certain other intangible assets (net of eligible deferred taxes).
Annualized – Adjusted to reflect a full year of activity.
Assets under management – Assets over which we have sole
or shared investment authority for our customers/clients. We
do not include these assets on our Consolidated Balance Sheet.
Basis point – One hundredth of a percentage point.
Carrying value of purchased impaired loans – The net value
on the balance sheet which represents the recorded investment
less any valuation allowance.
Cash recoveries – Cash recoveries used in the context of
purchased impaired loans represent cash payments from
customers that exceeded the recorded investment of the
designated impaired loan.
Charge-off – Process of removing a loan or portion of a loan
from our balance sheet because it is considered uncollectible.
We also record a charge-off when a loan is transferred from
portfolio holdings to held for sale by reducing the loan
carrying amount to the fair value of the loan, if fair value is
less than carrying amount.
Combined Loan-to-value ratio (CLTV) – This is the aggregate
principal balance(s) of the mortgages on a property divided by
its appraised value or purchase price.
Commercial mortgage banking activities – Includes
commercial mortgage servicing, originating commercial
mortgages for sale and related hedging activities. Commercial
mortgage banking activities revenue includes commercial
mortgage servicing (including net interest income and
noninterest income from loan servicing and ancillary services,
net of commercial mortgage servicing rights amortization, and
commercial mortgage servicing rights valuations), and
revenue derived from commercial mortgage loans intended for
sale and related hedges (including loan origination fees, net
interest income, valuation adjustments and gains or losses on
sales).
Common shareholders’ equity to total assets – Common
shareholders’ equity divided by total assets. Common
shareholders’ equity equals total shareholders’ equity less the
liquidation value of preferred stock.
Core net interest income – Total net interest income less
purchase accounting accretion.
Credit derivatives – Contractual agreements, primarily credit
default swaps, that provide protection against a credit event of
one or more referenced credits. The nature of a credit event is
The PNC Financial Services Group, Inc. – Form 10-K 95