PNC Bank 2011 Annual Report Download - page 66
Download and view the complete annual report
Please find page 66 of the 2011 PNC Bank annual report below. You can navigate through the pages in the report by either clicking on the pages listed below, or by using the keyword search tool below to find specific information within the annual report.-
 1
1 -
2
-
3
-
4
-
5
-
6
-
7
-
8
-
9
-
10
-
11
-
12
-
13
-
14
-
15
-
16
-
17
-
18
-
19
-
20
-
21
-
22
-
23
-
24
-
25
-
26
-
27
-
28
-
29
-
30
-
31
-
32
-
33
-
34
-
35
-
36
-
37
-
38
-
39
-
40
-
41
-
42
-
43
-
44
-
45
-
46
-
47
-
48
-
49
-
50
-
51
-
52
-
53
-
54
-
55
-
 56
56 -
 57
57 -
 58
58 -
 59
59 -
 60
60 -
 61
61 -
 62
62 -
 63
63 -
 64
64 -
 65
65 -
 66
66 -
 67
67 -
 68
68 -
 69
69 -
 70
70 -
 71
71 -
 72
72 -
 73
73 -
 74
74 -
 75
75 -
 76
76 -
77
-
78
-
79
-
80
-
81
-
82
-
83
-
84
-
85
-
86
-
87
-
88
-
89
-
90
-
91
-
92
-
93
-
94
-
95
-
96
-
97
-
98
-
99
-
100
-
101
-
102
-
103
-
104
-
105
-
106
-
107
-
108
-
109
-
110
-
111
-
112
-
113
-
114
-
115
-
116
-
117
-
118
-
119
-
120
-
121
-
122
-
123
-
124
-
125
-
126
-
127
-
128
-
129
-
130
-
131
-
132
-
133
-
134
-
135
-
136
-
137
-
138
-
139
-
140
-
141
-
142
-
143
-
144
-
145
-
146
-
147
-
148
-
149
-
150
-
151
-
152
-
153
-
154
-
155
-
156
-
157
-
158
-
159
-
160
-
161
-
162
-
163
-
164
-
165
-
166
-
167
-
168
-
169
-
170
-
171
-
172
-
173
-
174
-
175
-
176
-
177
-
178
-
179
-
180
-
181
-
182
-
183
-
184
-
185
-
186
-
187
-
188
-
189
-
190
-
191
-
192
-
193
-
194
-
195
-
196
-
197
-
198
-
199
-
200
-
201
-
202
-
203
-
204
-
205
-
206
-
207
-
208
-
209
-
210
-
211
-
212
-
213
-
214
-
215
-
216
-
217
-
218
-
219
-
220
-
221
-
222
-
223
-
224
-
225
-
226
-
227
-
228
-
229
-
230
-
231
-
232
-
233
-
234
-
235
-
236
-
237
-
238
 |
 |

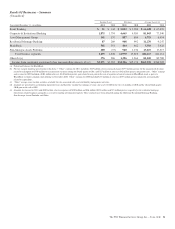
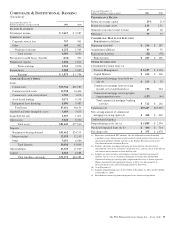
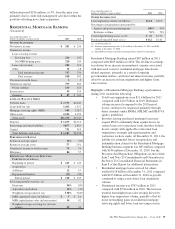
• PNC Equipment Finance is the 4th largest bank-
affiliated leasing company with over $9 billion in
equipment finance assets.
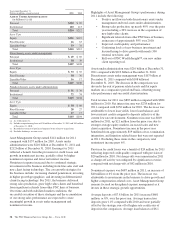
Average deposits were $50.0 billion in 2011, an increase of
$6.2 billion, or 14%, compared with 2010.
• Deposit growth has been very strong, particularly in
the second half of 2011, and is an industry-wide trend
as clients are holding record levels of cash and
liquidity.
• Deposit inflows into noninterest-bearing demand
deposits continued as FDIC insurance has been an
attraction for customers maintaining liquidity during
this prolonged period of low interest rates.
• The repeal of Regulation Q limitations on interest-
bearing commercial demand deposit accounts
became effective in the third quarter of 2011. As
expected, interest in this product has been muted due
to the current rate environment and the limited
amount of FDIC insurance coverage.
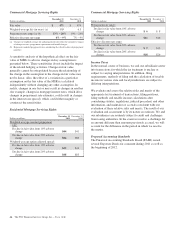
The commercial mortgage servicing portfolio was $267 billion
at December 31, 2011 compared with $266 billion
December 31, 2010. Servicing additions were mostly offset by
portfolio run-off.
See the additional revenue discussion regarding treasury
management, capital markets-related products and services,
and commercial mortgage banking activities in the Product
Revenue section of the Consolidated Income Statement
Review.
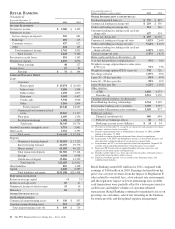
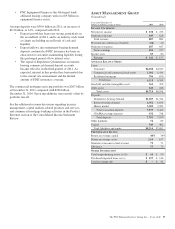
A
SSET
M
ANAGEMENT
G
ROUP
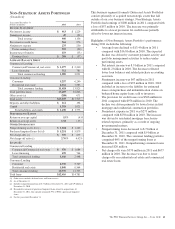
(Unaudited)
Year ended December 31
Dollars in millions, except as noted 2011 2010
I
NCOME
S
TATEMENT
Net interest income $ 238 $ 256
Noninterest income 649 628
Total revenue 887 884
Provision for credit losses (benefit) (24) 20
Noninterest expense 687 647
Pretax earnings 224 217
Income taxes 83 80
Earnings $ 141 $ 137
A
VERAGE
B
ALANCE
S
HEET
Loans
Consumer $4,108 $4,025
Commercial and commercial real estate 1,301 1,434
Residential mortgage 706 850
Total loans 6,115 6,309
Goodwill and other intangible assets 361 399
Other assets 243 246
Total assets $6,719 $6,954
Deposits
Noninterest-bearing demand $1,209 $1,324
Interest-bearing demand 2,361 1,835
Money market 3,589 3,283
Total transaction deposits 7,159 6,442
CDs/IRAs/savings deposits 632 748
Total deposits 7,791 7,190
Other liabilities 74 89
Capital 349 402
Total liabilities and equity $8,214 $7,681
P
ERFORMANCE
R
ATIOS
Return on average capital 40% 34%
Return on average assets 2.10 1.97
Noninterest income to total revenue 73 71
Efficiency 77 73
O
THER
I
NFORMATION
Total nonperforming assets (a) (b) $60$90
Purchased impaired loans (a) (c) $ 127 $ 146
Total net charge-offs $–$42
The PNC Financial Services Group, Inc. – Form 10-K 57