PNC Bank 2011 Annual Report Download - page 62
Download and view the complete annual report
Please find page 62 of the 2011 PNC Bank annual report below. You can navigate through the pages in the report by either clicking on the pages listed below, or by using the keyword search tool below to find specific information within the annual report.-
 1
1 -
2
-
3
-
4
-
5
-
6
-
7
-
8
-
9
-
10
-
11
-
12
-
13
-
14
-
15
-
16
-
17
-
18
-
19
-
20
-
21
-
22
-
23
-
24
-
25
-
26
-
27
-
28
-
29
-
30
-
31
-
32
-
33
-
34
-
35
-
36
-
37
-
38
-
39
-
40
-
41
-
42
-
43
-
44
-
45
-
46
-
47
-
48
-
49
-
50
-
51
-
 52
52 -
 53
53 -
 54
54 -
 55
55 -
 56
56 -
 57
57 -
 58
58 -
 59
59 -
 60
60 -
 61
61 -
 62
62 -
 63
63 -
 64
64 -
 65
65 -
 66
66 -
 67
67 -
 68
68 -
 69
69 -
 70
70 -
 71
71 -
 72
72 -
73
-
74
-
75
-
76
-
77
-
78
-
79
-
80
-
81
-
82
-
83
-
84
-
85
-
86
-
87
-
88
-
89
-
90
-
91
-
92
-
93
-
94
-
95
-
96
-
97
-
98
-
99
-
100
-
101
-
102
-
103
-
104
-
105
-
106
-
107
-
108
-
109
-
110
-
111
-
112
-
113
-
114
-
115
-
116
-
117
-
118
-
119
-
120
-
121
-
122
-
123
-
124
-
125
-
126
-
127
-
128
-
129
-
130
-
131
-
132
-
133
-
134
-
135
-
136
-
137
-
138
-
139
-
140
-
141
-
142
-
143
-
144
-
145
-
146
-
147
-
148
-
149
-
150
-
151
-
152
-
153
-
154
-
155
-
156
-
157
-
158
-
159
-
160
-
161
-
162
-
163
-
164
-
165
-
166
-
167
-
168
-
169
-
170
-
171
-
172
-
173
-
174
-
175
-
176
-
177
-
178
-
179
-
180
-
181
-
182
-
183
-
184
-
185
-
186
-
187
-
188
-
189
-
190
-
191
-
192
-
193
-
194
-
195
-
196
-
197
-
198
-
199
-
200
-
201
-
202
-
203
-
204
-
205
-
206
-
207
-
208
-
209
-
210
-
211
-
212
-
213
-
214
-
215
-
216
-
217
-
218
-
219
-
220
-
221
-
222
-
223
-
224
-
225
-
226
-
227
-
228
-
229
-
230
-
231
-
232
-
233
-
234
-
235
-
236
-
237
-
238
 |
 |
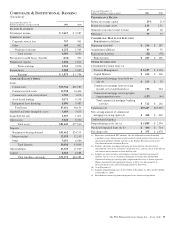
Retail Banking’s core strategy is to grow checking deposits as
a low-cost funding source and as the cornerstone product to
build valuable customer relationships. The goal is to acquire
and retain customers who maintain their primary checking and
transaction relationships with PNC. The business is focused
on deepening its share of customers’ financial assets,
including savings and liquid deposits, investable assets and
loans through sales strategies, differentiated product offerings
and customer satisfaction. In this challenging economic
environment, Retail Banking is also focused on expanding the
use of alternative, lower cost distribution channels while
continuing to optimize its traditional branch network. The
business has an expansive and growing branch footprint
covering nearly one-third of the U.S. population in 14 states
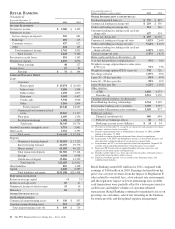
and Washington, D.C. with a network of 2,511 branches and
6,806 ATMs at December 31, 2011.
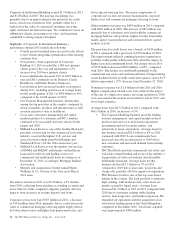
Successful execution of the Retail Banking strategy in 2011 is
reflected in the following:
• Net new checking relationships grew 296,000 in
2011, including 41,000 from the BankAtlantic and
Flagstar branch acquisitions. The growth reflects
strong results and gains in all of our markets. We are
seeing strong customer retention in the overall
network.
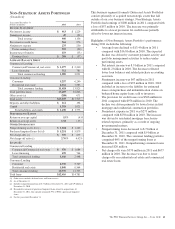
• Continued success in implementing Retail Banking’s
deposit strategy resulted in growth in average
transaction deposits and a reduction in higher rate
certificates of deposit. In 2011 average transaction
deposits grew $4.3 billion, or 6%, over 2010 and
average certificates of deposit declined $8.5 billion,
or 21% in accordance with our business plan.
• In December 2011, Retail Banking added
approximately $210 million in deposits, 9,000
checking relationships, 27 branches and 29 ATMs
through the branch acquisition from Flagstar Bank,
FSB, in the northern metropolitan Atlanta, Georgia
area.
• In June 2011, Retail Banking added approximately
$280 million in deposits, 32,000 checking
relationships, 19 branches and 27 ATMs through the
branch acquisition from BankAtlantic in the greater
Tampa, Florida area.
• The planned acquisition of RBC Bank (USA) is
expected to expand PNC’s footprint to 17 states and
Washington, D.C. and nearly 2,900 branches. The
transaction is currently expected to close in March
2012 subject to remaining customary closing
conditions. PNC and RBC Bank (USA) have both
received regulatory approvals in relation to the
respective applications filed with the regulators.
• Our investment in online banking capabilities
continues to pay off as active online banking
customers and active online bill payment customers
grew by 15% and 13%, respectively, in 2011.
• Retail Banking launched new checking account and
credit card products during the first quarter of 2011.
These new products are designed to provide more
choices for customers and grow value of clients for
PNC.
• Our award-winning Virtual Wallet®product is
providing strong momentum for customer growth.
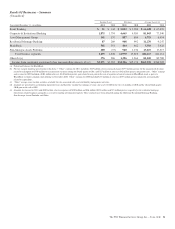
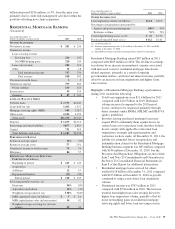
Total revenue for 2011 was $5.0 billion compared with $5.4
billion for 2010. Net interest income of $3.3 billion declined
$155 million compared with 2010. The decrease over the prior
period resulted from lower interest credits assigned to
deposits, reflective of the rate environment, and lower average
loan balances somewhat offset by higher demand deposit
balances and a decrease in higher rate certificates of deposit
balances.
Noninterest income for 2011 declined $189 million compared
to 2010. The decline was driven by lower overdraft fees
resulting from the impact of Regulation E rules and lower
interchange rates on debit card transactions, partially offset by
higher volumes of customer-initiated transactions including
debit and credit cards.
For 2011, Retail Banking revenue was negatively impacted by
approximately $275 million compared with 2010 due to the
impact of the rules set forth in Regulation E related to
overdraft fees and the Dodd-Frank limits related to
interchange rates on debit card transactions.
• Regulation E, which became effective in the third
quarter of 2010, had an incremental negative impact
to 2011 revenues of approximately $200 million
compared with 2010.
• The Dodd-Frank limits related to interchange fees
were effective October 1, 2011 and had a negative
impact on revenues of approximately $75 million in
the fourth quarter of 2011 and are expected to have
an additional incremental reduction in 2012 annual
revenue of approximately $175 million, based on
2011 transaction volumes.
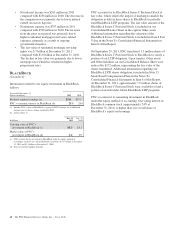
The provision for credit losses was $.9 billion in 2011
compared with $1.1 billion in 2010. Net charge-offs were $.9
billion for 2011 compared with $1.1 billion in the prior year.
Improvements in credit quality are evident in the small
business and credit card portfolios. We have continued to see
increases in home equity delinquencies and as a result, we
have worked with borrowers as employment and home values
have been slow to recover in this economy. The level of
provisioning will be dependent on general economic
conditions, loan growth, utilization of credit commitments and
asset quality.
Noninterest expense in 2011 increased $47 million from 2010.
The increase was primarily attributable to selective investment
in key areas of the business largely offset by lower FDIC
expenses.
Growing core checking deposits is key to the Retail Banking
strategy, and is critical to growing our overall payments
business. The deposit product strategy of Retail Banking is to
remain disciplined on pricing, target specific products and
The PNC Financial Services Group, Inc. – Form 10-K 53