PNC Bank 2011 Annual Report Download - page 138
Download and view the complete annual report
Please find page 138 of the 2011 PNC Bank annual report below. You can navigate through the pages in the report by either clicking on the pages listed below, or by using the keyword search tool below to find specific information within the annual report.-
 1
1 -
2
-
3
-
4
-
5
-
6
-
7
-
8
-
9
-
10
-
11
-
12
-
13
-
14
-
15
-
16
-
17
-
18
-
19
-
20
-
21
-
22
-
23
-
24
-
25
-
26
-
27
-
28
-
29
-
30
-
31
-
32
-
33
-
34
-
35
-
36
-
37
-
38
-
39
-
40
-
41
-
42
-
43
-
44
-
45
-
46
-
47
-
48
-
49
-
50
-
51
-
52
-
53
-
54
-
55
-
56
-
57
-
58
-
59
-
60
-
61
-
62
-
63
-
64
-
65
-
66
-
67
-
68
-
69
-
70
-
71
-
72
-
73
-
74
-
75
-
76
-
77
-
78
-
79
-
80
-
81
-
82
-
83
-
84
-
85
-
86
-
87
-
88
-
89
-
90
-
91
-
92
-
93
-
94
-
95
-
96
-
97
-
98
-
99
-
100
-
101
-
102
-
103
-
104
-
105
-
106
-
107
-
108
-
109
-
110
-
111
-
112
-
113
-
114
-
115
-
116
-
117
-
118
-
119
-
120
-
121
-
122
-
123
-
124
-
125
-
126
-
127
-
 128
128 -
 129
129 -
 130
130 -
 131
131 -
 132
132 -
 133
133 -
 134
134 -
 135
135 -
 136
136 -
 137
137 -
 138
138 -
 139
139 -
 140
140 -
 141
141 -
 142
142 -
 143
143 -
 144
144 -
 145
145 -
 146
146 -
 147
147 -
 148
148 -
149
-
150
-
151
-
152
-
153
-
154
-
155
-
156
-
157
-
158
-
159
-
160
-
161
-
162
-
163
-
164
-
165
-
166
-
167
-
168
-
169
-
170
-
171
-
172
-
173
-
174
-
175
-
176
-
177
-
178
-
179
-
180
-
181
-
182
-
183
-
184
-
185
-
186
-
187
-
188
-
189
-
190
-
191
-
192
-
193
-
194
-
195
-
196
-
197
-
198
-
199
-
200
-
201
-
202
-
203
-
204
-
205
-
206
-
207
-
208
-
209
-
210
-
211
-
212
-
213
-
214
-
215
-
216
-
217
-
218
-
219
-
220
-
221
-
222
-
223
-
224
-
225
-
226
-
227
-
228
-
229
-
230
-
231
-
232
-
233
-
234
-
235
-
236
-
237
-
238
 |
 |

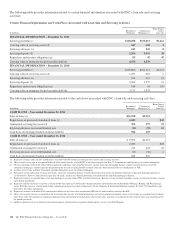
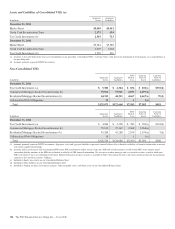
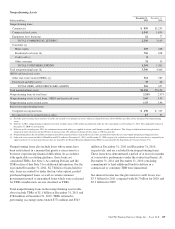
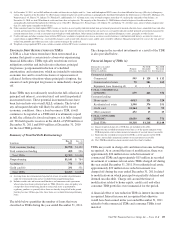
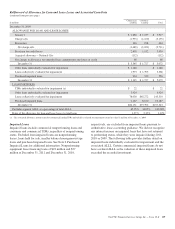
Nonperforming Assets
Dollars in millions
December 31,
2011
December 31,
2010
Nonperforming loans
Commercial $ 899 $1,253
Commercial real estate 1,345 1,835
Equipment lease financing 22 77
TOTAL COMMERCIAL LENDING 2,266 3,165
Consumer (a)
Home equity 529 448
Residential real estate (b) 726 818
Credit card (c) 8
Other consumer 31 35
TOTAL CONSUMER LENDING 1,294 1,301
Total nonperforming loans (d) 3,560 4,466
OREO and foreclosed assets
Other real estate owned (OREO) (e) 561 589
Foreclosed and other assets 35 68
TOTAL OREO AND FORECLOSED ASSETS 596 657
Total nonperforming assets $4,156 $5,123
Nonperforming loans to total loans 2.24% 2.97%
Nonperforming assets to total loans, OREO and foreclosed assets 2.60 3.39
Nonperforming assets to total assets 1.53 1.94
Interest on nonperforming loans
Computed on original terms $ 278 $ 329
Recognized prior to nonperforming status 47 53
(a) Excludes most consumer loans and lines of credit, not secured by residential real estate, which are charged off after 120 to 180 days past due and are not placed on nonperforming
status.
(b) Effective in 2011, nonperforming residential real estate excludes loans of $61 million accounted for under the fair value option as of December 31, 2011. The comparable balance at
December 31, 2010 was not material.
(c) Effective in the second quarter 2011, the commercial nonaccrual policy was applied to certain small business credit card balances. This change resulted in loans being placed on
nonaccrual status when they become 90 days or more past due. We continue to charge off these loans at 180 days past due.
(d) Nonperforming loans do not include government insured or guaranteed loans, loans held for sale, loans accounted for under the fair value option and purchased impaired loans.
(e) Other real estate owned excludes $280 million and $178 million at December 31, 2011, and December 31, 2010, respectively, related to residential real estate that was acquired by us
upon foreclosure of serviced loans because they are insured by the Federal Housing Administration (FHA) or guaranteed by the Department of Veterans Affairs (VA).
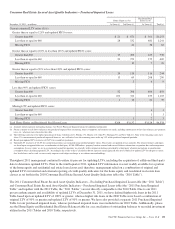
Nonperforming loans also include loans whose terms have
been restructured in a manner that grants a concession to a
borrower experiencing financial difficulties. In accordance
with applicable accounting guidance, these loans are
considered TDRs. See Note 1 Accounting Policies and the
TDR section of this Note 5 for additional information. For the
year ended December 31, 2011, $2.7 billion of loans held for
sale, loans accounted for under the fair value option, pooled
purchased impaired loans, as well as certain consumer
government insured or guaranteed loans which were evaluated
for TDR consideration, are not classified as TDRs.
Total nonperforming loans in the nonperforming assets table
above include TDRs of $1.1 billion at December 31, 2011 and
$784 million at December 31, 2010. TDRs returned to
performing (accruing) status totaled $771 million and $543
million at December 31, 2011 and December 31, 2010,
respectively, and are excluded from nonperforming loans.
These loans have demonstrated a period of at least six months
of consecutive performance under the restructured terms. At
December 31, 2011 and December 31, 2010, remaining
commitments to lend additional funds to debtors in a
commercial or consumer TDR were immaterial.
Net interest income less the provision for credit losses was
$7.5 billion for 2011 compared with $6.7 billion for 2010 and
$5.2 billion for 2009.
The PNC Financial Services Group, Inc. – Form 10-K 129