PNC Bank 2011 Annual Report Download - page 178
Download and view the complete annual report
Please find page 178 of the 2011 PNC Bank annual report below. You can navigate through the pages in the report by either clicking on the pages listed below, or by using the keyword search tool below to find specific information within the annual report.-
 1
1 -
2
-
3
-
4
-
5
-
6
-
7
-
8
-
9
-
10
-
11
-
12
-
13
-
14
-
15
-
16
-
17
-
18
-
19
-
20
-
21
-
22
-
23
-
24
-
25
-
26
-
27
-
28
-
29
-
30
-
31
-
32
-
33
-
34
-
35
-
36
-
37
-
38
-
39
-
40
-
41
-
42
-
43
-
44
-
45
-
46
-
47
-
48
-
49
-
50
-
51
-
52
-
53
-
54
-
55
-
56
-
57
-
58
-
59
-
60
-
61
-
62
-
63
-
64
-
65
-
66
-
67
-
68
-
69
-
70
-
71
-
72
-
73
-
74
-
75
-
76
-
77
-
78
-
79
-
80
-
81
-
82
-
83
-
84
-
85
-
86
-
87
-
88
-
89
-
90
-
91
-
92
-
93
-
94
-
95
-
96
-
97
-
98
-
99
-
100
-
101
-
102
-
103
-
104
-
105
-
106
-
107
-
108
-
109
-
110
-
111
-
112
-
113
-
114
-
115
-
116
-
117
-
118
-
119
-
120
-
121
-
122
-
123
-
124
-
125
-
126
-
127
-
128
-
129
-
130
-
131
-
132
-
133
-
134
-
135
-
136
-
137
-
138
-
139
-
140
-
141
-
142
-
143
-
144
-
145
-
146
-
147
-
148
-
149
-
150
-
151
-
152
-
153
-
154
-
155
-
156
-
157
-
158
-
159
-
160
-
161
-
162
-
163
-
164
-
165
-
166
-
167
-
 168
168 -
 169
169 -
 170
170 -
 171
171 -
 172
172 -
 173
173 -
 174
174 -
 175
175 -
 176
176 -
 177
177 -
 178
178 -
 179
179 -
 180
180 -
 181
181 -
 182
182 -
 183
183 -
 184
184 -
 185
185 -
 186
186 -
 187
187 -
 188
188 -
189
-
190
-
191
-
192
-
193
-
194
-
195
-
196
-
197
-
198
-
199
-
200
-
201
-
202
-
203
-
204
-
205
-
206
-
207
-
208
-
209
-
210
-
211
-
212
-
213
-
214
-
215
-
216
-
217
-
218
-
219
-
220
-
221
-
222
-
223
-
224
-
225
-
226
-
227
-
228
-
229
-
230
-
231
-
232
-
233
-
234
-
235
-
236
-
237
-
238
 |
 |

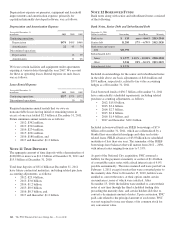
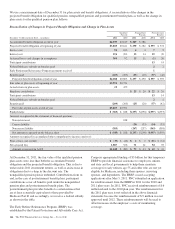
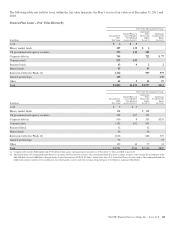
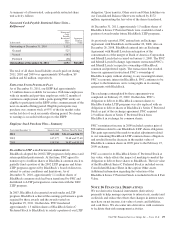
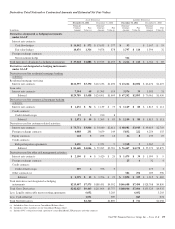
The following table sets forth by level, within the fair value hierarchy, the Plan’s assets at fair value as of December 31, 2011 and
2010:
Pension Plan Assets – Fair Value Hierarchy
Fair Value Measurements Using:
In millions
December 31
2011
Fair Value
Quoted Prices in
Active Markets
For Identical
Assets (Level 1)
Significant
Other
Observable
Inputs
(Level 2)
Significant
Unobservable
Inputs
(Level 3)
Cash $2 $2
Money market funds 137 135 $ 2
US government and agency securities 395 114 281
Corporate debt (a) 799 722 $ 77
Common stock 933 933
Preferred stock 13 9 2 2
Mutual funds 37 37
Interest in Collective Funds (b) 1,314 937 377
Limited partnerships 130 130
Other 45 2 16 27
Total $3,805 $1,195 $1,997 $613
Fair Value Measurements Using:
In millions
December 31
2010
Fair Value
Quoted Prices in
Active Markets
For Identical
Assets (Level 1)
Significant
Other
Observable
Inputs
(Level 2)
Significant
Unobservable
Inputs
(Level 3)
Cash $5 $5
Money market funds 108 $ 108
US government and agency securities 518 267 251
Corporate debt (a) 916 8 555 $353
Common stock 1,153 652 501
Preferred Stock 42 42
Mutual funds 36 36
Interest in Collective Funds (b) 1,016 646 370
Limited partnerships 75 75
Other 122 14 77 31
Total $3,991 $946 $2,216 $829
(a) Corporate debt includes $106 million and $175 million of non-agency mortgage-backed securities as of December 31, 2011 and 2010, respectively.
(b) The benefit plans own commingled funds that invest in equity and fixed income securities. The commingled funds that invest in equity securities seek to mirror the performance of the
S&P 500 Index, Russell 3000 Index, Morgan Stanley Capital International ACWI X US Index, and the Dow Jones U.S. Select Real Estate Securities Index. The commingled fund that
holds fixed income securities invests in domestic investment grade securities and seeks to mimic the performance of the Barclays Aggregate Bond Index.
The PNC Financial Services Group, Inc. – Form 10-K 169