PNC Bank 2011 Annual Report Download - page 85
Download and view the complete annual report
Please find page 85 of the 2011 PNC Bank annual report below. You can navigate through the pages in the report by either clicking on the pages listed below, or by using the keyword search tool below to find specific information within the annual report.-
 1
1 -
2
-
3
-
4
-
5
-
6
-
7
-
8
-
9
-
10
-
11
-
12
-
13
-
14
-
15
-
16
-
17
-
18
-
19
-
20
-
21
-
22
-
23
-
24
-
25
-
26
-
27
-
28
-
29
-
30
-
31
-
32
-
33
-
34
-
35
-
36
-
37
-
38
-
39
-
40
-
41
-
42
-
43
-
44
-
45
-
46
-
47
-
48
-
49
-
50
-
51
-
52
-
53
-
54
-
55
-
56
-
57
-
58
-
59
-
60
-
61
-
62
-
63
-
64
-
65
-
66
-
67
-
68
-
69
-
70
-
71
-
72
-
73
-
74
-
 75
75 -
 76
76 -
 77
77 -
 78
78 -
 79
79 -
 80
80 -
 81
81 -
 82
82 -
 83
83 -
 84
84 -
 85
85 -
 86
86 -
 87
87 -
 88
88 -
 89
89 -
 90
90 -
 91
91 -
 92
92 -
 93
93 -
 94
94 -
 95
95 -
96
-
97
-
98
-
99
-
100
-
101
-
102
-
103
-
104
-
105
-
106
-
107
-
108
-
109
-
110
-
111
-
112
-
113
-
114
-
115
-
116
-
117
-
118
-
119
-
120
-
121
-
122
-
123
-
124
-
125
-
126
-
127
-
128
-
129
-
130
-
131
-
132
-
133
-
134
-
135
-
136
-
137
-
138
-
139
-
140
-
141
-
142
-
143
-
144
-
145
-
146
-
147
-
148
-
149
-
150
-
151
-
152
-
153
-
154
-
155
-
156
-
157
-
158
-
159
-
160
-
161
-
162
-
163
-
164
-
165
-
166
-
167
-
168
-
169
-
170
-
171
-
172
-
173
-
174
-
175
-
176
-
177
-
178
-
179
-
180
-
181
-
182
-
183
-
184
-
185
-
186
-
187
-
188
-
189
-
190
-
191
-
192
-
193
-
194
-
195
-
196
-
197
-
198
-
199
-
200
-
201
-
202
-
203
-
204
-
205
-
206
-
207
-
208
-
209
-
210
-
211
-
212
-
213
-
214
-
215
-
216
-
217
-
218
-
219
-
220
-
221
-
222
-
223
-
224
-
225
-
226
-
227
-
228
-
229
-
230
-
231
-
232
-
233
-
234
-
235
-
236
-
237
-
238
 |
 |

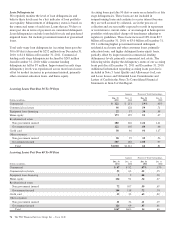
Loan Delinquencies
We regularly monitor the level of loan delinquencies and
believe these levels may be a key indicator of loan portfolio
asset quality. Measurement of delinquency status is based on
the contractual terms of each loan. Loans that are 30 days or
more past due in terms of payment are considered delinquent.
Loan delinquencies exclude loans held for sale and purchased
impaired loans, but include government insured or guaranteed
loans.
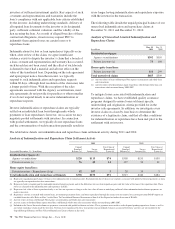
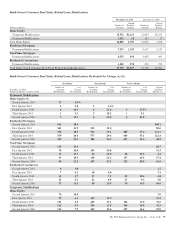
Total early stage loan delinquencies (accruing loans past due
30 to 89 days) decreased by $252 million from December 31,
2010, to $1.6 billion at December 31, 2011. Commercial
lending early stage delinquencies declined by $245 million
from December 31, 2010, while consumer lending
delinquencies fell by $7 million. Improvement in early stage
delinquency levels was experienced across most loan classes,
offset by modest increases in government insured, primarily
other consumer education loans, and home equity.
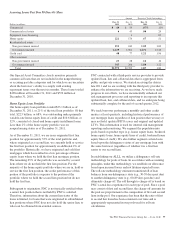
Accruing loans past due 90 days or more are referred to as late
stage delinquencies. These loans are not included in
nonperforming loans and continue to accrue interest because
they are well secured by collateral, are in the process of
collection and are reasonably expected to result in repayment
or restoration to current status, or are managed in homogenous
portfolios with specified charge-off timeframes adhering to
regulatory guidelines. These loans increased 10% from $2.7
billion at December 31, 2010, to $3.0 billion at December 31,
2011, reflecting higher government insured delinquent
residential real estate and other consumer loans, primarily
education loans, and higher delinquent home equity loans,
partially offset by improvement in commercial lending
delinquency levels, primarily commercial real estate. The
following tables display the delinquency status of our accruing
loans past due at December 31, 2011 and December 31, 2010.
Additional information regarding accruing loans past due is
included in Note 5 Asset Quality and Allowances for Loan
and Lease Losses and Unfunded Loan Commitments and
Letters of Credit in the Notes To Consolidated Financial
Statements in Item 8 of this Report.
Accruing Loans Past Due 30 To 59 Days
Amount Percent of Total Outstandings
Dollars in millions
Dec. 31
2011
Dec. 31
2010
Dec. 31
2011
Dec. 31
2010
Commercial $ 122 $ 251 .19% .45%
Commercial real estate 96 128 .59 .71
Equipment lease financing 22 37 .34 .58
Home equity 173 159 .52 .47
Residential real estate
Non government insured 180 226 1.24 1.41
Government insured 122 105 .84 .66
Credit card 38 46 .96 1.17
Other consumer
Non government insured 58 95 .30 .56
Government insured 207 165 1.08 .97
Total $1,018 $1,212 .64 .81
Accruing Loans Past Due 60 To 89 Days
Amount Percent of Total Outstandings
Dollars in millions
Dec. 31
2011
Dec. 31
2010
Dec. 31
2011
Dec. 31
2010
Commercial $47 $92 .07% .17%
Commercial real estate 35 62 .22 .35
Equipment lease financing 52.08 .03
Home equity 114 91 .34 .27
Residential real estate
Non government insured 72 107 .50 .67
Government insured 104 118 .72 .74
Credit card 25 32 .63 .82
Other consumer
Non government insured 21 32 .11 .19
Government insured 124 69 .65 .41
Total $547 $605 .34 .40
76 The PNC Financial Services Group, Inc. – Form 10-K