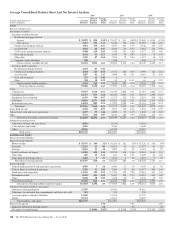
PNC Bank 2011 Annual Report Download - page 219
Download and view the complete annual report
Please find page 219 of the 2011 PNC Bank annual report below. You can navigate through the pages in the report by either clicking on the pages listed below, or by using the keyword search tool below to find specific information within the annual report.-
 1
1 -
2
-
3
-
4
-
5
-
6
-
7
-
8
-
9
-
10
-
11
-
12
-
13
-
14
-
15
-
16
-
17
-
18
-
19
-
20
-
21
-
22
-
23
-
24
-
25
-
26
-
27
-
28
-
29
-
30
-
31
-
32
-
33
-
34
-
35
-
36
-
37
-
38
-
39
-
40
-
41
-
42
-
43
-
44
-
45
-
46
-
47
-
48
-
49
-
50
-
51
-
52
-
53
-
54
-
55
-
56
-
57
-
58
-
59
-
60
-
61
-
62
-
63
-
64
-
65
-
66
-
67
-
68
-
69
-
70
-
71
-
72
-
73
-
74
-
75
-
76
-
77
-
78
-
79
-
80
-
81
-
82
-
83
-
84
-
85
-
86
-
87
-
88
-
89
-
90
-
91
-
92
-
93
-
94
-
95
-
96
-
97
-
98
-
99
-
100
-
101
-
102
-
103
-
104
-
105
-
106
-
107
-
108
-
109
-
110
-
111
-
112
-
113
-
114
-
115
-
116
-
117
-
118
-
119
-
120
-
121
-
122
-
123
-
124
-
125
-
126
-
127
-
128
-
129
-
130
-
131
-
132
-
133
-
134
-
135
-
136
-
137
-
138
-
139
-
140
-
141
-
142
-
143
-
144
-
145
-
146
-
147
-
148
-
149
-
150
-
151
-
152
-
153
-
154
-
155
-
156
-
157
-
158
-
159
-
160
-
161
-
162
-
163
-
164
-
165
-
166
-
167
-
168
-
169
-
170
-
171
-
172
-
173
-
174
-
175
-
176
-
177
-
178
-
179
-
180
-
181
-
182
-
183
-
184
-
185
-
186
-
187
-
188
-
189
-
190
-
191
-
192
-
193
-
194
-
195
-
196
-
197
-
198
-
199
-
200
-
201
-
202
-
203
-
204
-
205
-
206
-
207
-
208
-
 209
209 -
 210
210 -
 211
211 -
 212
212 -
 213
213 -
 214
214 -
 215
215 -
 216
216 -
 217
217 -
 218
218 -
 219
219 -
 220
220 -
 221
221 -
 222
222 -
 223
223 -
 224
224 -
 225
225 -
 226
226 -
 227
227 -
 228
228 -
 229
229 -
230
-
231
-
232
-
233
-
234
-
235
-
236
-
237
-
238
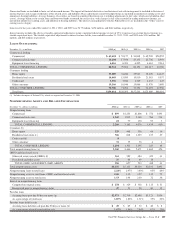
 |
 |

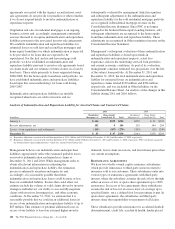
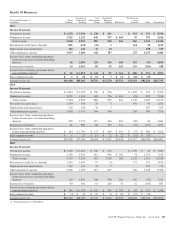
(a) Includes the impact of National City, which we acquired on December 31, 2008.
(b) Excludes most consumer loans and lines of credit, not secured by residential real estate, which are charged off after 120 to 180 days past due and are not placed on nonperforming
status.
(c) Effective in 2011, nonperforming residential real estate excludes loans of $61 million accounted for under the fair value option as of December 31, 2011. The comparable balances for
prior periods presented were not material.
(d) Effective in the second quarter 2011, the commercial nonaccrual policy was applied to certain small business credit card balances. This change resulted in loans being placed on
nonaccrual status when they become 90 days or more past due. We continue to charge off these loans at 180 days past due.
(e) Includes TDRs of $1,141 million at December 31, 2011, $784 million at December 31, 2010, $440 million at December 31, 2009 and $2 million at December 31, 2007.
Nonperforming loans do not include government insured or guaranteed loans, loans held for sale, loans accounted for under the fair value option and purchased impaired loans.
(f) Other real estate owned excludes $280 million, $178 million, $112 million, $81 million and zero at December 31, 2011, December 31, 2010, December 31, 2009, December 31, 2008
and December 31, 2007, respectively, related to residential real estate that was acquired by us upon foreclosure of serviced loans because they are insured by the Federal Housing
Administration (FHA) or guaranteed by the Department of Veterans Affairs (VA).
(g) Amounts include government insured or guaranteed consumer loans totaling $2,474 million, $2,167 million, $1,814 million, $926 million and $8 million at December 31,
2011, December 31, 2010, December 31, 2009, December 31, 2008 and December 31, 2007, respectively. Past due loan amounts exclude purchased impaired loans as they are
considered current loans due to the accretion of interest income.
(h) Amounts include government insured or guaranteed consumer loans held for sale totaling $15 million, $22 million, and $27 million at December 31, 2011, December 31, 2010, and
December 31, 2009, respectively. Government insured or guaranteed consumer loans held for sale were zero for the other periods presented.
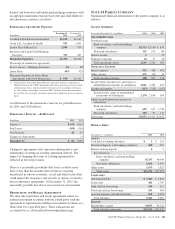
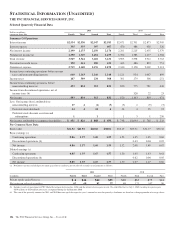
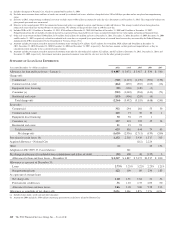
S
UMMARY OF
L
OAN
L
OSS
E
XPERIENCE
Year ended December 31 - dollars in millions 2011 2010 2009 2008 2007
Allowance for loan and lease losses – January 1 $ 4,887 $ 5,072 $ 3,917 $ 830 $ 560
Charge-offs
Commercial (700) (1,227) (1,276) (301) (156)
Commercial real estate (464) (670) (510) (165) (16)
Equipment lease financing (35) (120) (149) (3)
Consumer (a) (912) (1,069) (961) (143) (73)
Residential real estate (153) (406) (259) (6)
Total charge-offs (2,264) (3,492) (3,155) (618) (245)
Recoveries
Commercial 332 294 181 53 30
Commercial real estate 105 77 38 10 1
Equipment lease financing 50 56 27 1
Consumer (a) 127 110 105 15 14
Residential real estate 11 19 93
Total recoveries 625 556 444 79 45
Net charge-offs (1,639) (2,936) (2,711) (539) (200)
Provision for credit losses (b) 1,152 2,502 3,930 1,517 315
Acquired allowance – National City (112) 2,224
Other (1) 20 152
Adoption of ASU 2009-17, Consolidations 141
Net change in allowance for unfunded loan commitments and letters of credit (52) 108 48 (135) 3
Allowance for loan and lease losses – December 31 $ 4,347 $ 4,887 $ 5,072 $3,917 $ 830
Allowance as a percent of December 31:
Loans 2.73% 3.25% 3.22% 2.23% 1.21%
Nonperforming loans 122 109 89 236 183
As a percent of average loans
Net charge-offs 1.08 1.91 1.64 .74 .32
Provision for credit losses .76 1.63 2.37 2.09 .50
Allowance for loan and lease losses 2.86 3.18 3.06 5.38 1.33
Allowance as a multiple of net charge-offs 2.65x 1.66x 1.87x 7.27x 4.15x
(a) Includes home equity, credit card and other consumer.
(b) Amount for 2008 included a $504 million conforming provision for credit losses related to National City.
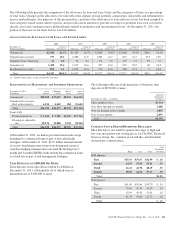
210 The PNC Financial Services Group, Inc. – Form 10-K