PNC Bank 2011 Annual Report Download - page 102
Download and view the complete annual report
Please find page 102 of the 2011 PNC Bank annual report below. You can navigate through the pages in the report by either clicking on the pages listed below, or by using the keyword search tool below to find specific information within the annual report.-
 1
1 -
2
-
3
-
4
-
5
-
6
-
7
-
8
-
9
-
10
-
11
-
12
-
13
-
14
-
15
-
16
-
17
-
18
-
19
-
20
-
21
-
22
-
23
-
24
-
25
-
26
-
27
-
28
-
29
-
30
-
31
-
32
-
33
-
34
-
35
-
36
-
37
-
38
-
39
-
40
-
41
-
42
-
43
-
44
-
45
-
46
-
47
-
48
-
49
-
50
-
51
-
52
-
53
-
54
-
55
-
56
-
57
-
58
-
59
-
60
-
61
-
62
-
63
-
64
-
65
-
66
-
67
-
68
-
69
-
70
-
71
-
72
-
73
-
74
-
75
-
76
-
77
-
78
-
79
-
80
-
81
-
82
-
83
-
84
-
85
-
86
-
87
-
88
-
89
-
90
-
91
-
 92
92 -
 93
93 -
 94
94 -
 95
95 -
 96
96 -
 97
97 -
 98
98 -
 99
99 -
 100
100 -
 101
101 -
 102
102 -
 103
103 -
 104
104 -
 105
105 -
 106
106 -
 107
107 -
 108
108 -
 109
109 -
 110
110 -
 111
111 -
 112
112 -
113
-
114
-
115
-
116
-
117
-
118
-
119
-
120
-
121
-
122
-
123
-
124
-
125
-
126
-
127
-
128
-
129
-
130
-
131
-
132
-
133
-
134
-
135
-
136
-
137
-
138
-
139
-
140
-
141
-
142
-
143
-
144
-
145
-
146
-
147
-
148
-
149
-
150
-
151
-
152
-
153
-
154
-
155
-
156
-
157
-
158
-
159
-
160
-
161
-
162
-
163
-
164
-
165
-
166
-
167
-
168
-
169
-
170
-
171
-
172
-
173
-
174
-
175
-
176
-
177
-
178
-
179
-
180
-
181
-
182
-
183
-
184
-
185
-
186
-
187
-
188
-
189
-
190
-
191
-
192
-
193
-
194
-
195
-
196
-
197
-
198
-
199
-
200
-
201
-
202
-
203
-
204
-
205
-
206
-
207
-
208
-
209
-
210
-
211
-
212
-
213
-
214
-
215
-
216
-
217
-
218
-
219
-
220
-
221
-
222
-
223
-
224
-
225
-
226
-
227
-
228
-
229
-
230
-
231
-
232
-
233
-
234
-
235
-
236
-
237
-
238
 |
 |

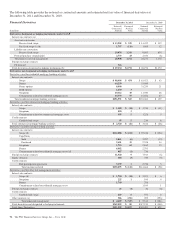
(a) The floating rate portion of interest rate contracts is based on money-market indices. As a percent of notional amount, 57% were based on 1-month LIBOR and 43% on 3-month
LIBOR at December 31, 2011 compared with 58% and 42%, respectively, at December 31, 2010.
(b) Fair value amount includes net accrued interest receivable of $140 million at December 31, 2011 and $132 million at December 31, 2010.
(c) Includes zero-coupon swaps.
(d) The increases in the negative fair values from December 31, 2010 to December 31, 2011 for interest rate contracts, foreign exchange, equity contracts and other contracts were due to
the changes in fair values of the existing contracts along with new contracts entered into during 2011 and contracts terminated during that period.
(e) Includes PNC’s obligation to fund a portion of certain BlackRock LTIP programs and other contracts.
2010 V
ERSUS
2009
C
ONSOLIDATED
I
NCOME
S
TATEMENT
R
EVIEW
Summary Results
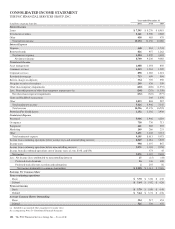
Net income for 2010 was $3.4 billion, or $5.74 per diluted
common share and for 2009 was $2.4 billion or $4.36 per
diluted common share. For 2010, net income attributable to
common shareholders and diluted earnings per common share
were impacted by a noncash reduction of $250 million related
to our redemption of TARP preferred stock.
Net Interest Income
Net interest income was $9.2 billion for 2010 up 2% from
2009, while the net interest margin rose to 4.14% in 2010
compared with 3.82% for 2009.
Noninterest Income
Summary
Noninterest income was $5.9 billion for 2010 and $7.1 billion
for 2009. The primary driver of this change was a reduction of
$916 million for BlackRock related transactions. During
fourth quarter 2010, we realized a pretax gain of $160 million
on 7.5 million BlackRock common shares sold by PNC as a
part of a BlackRock secondary common stock offering.
During fourth quarter 2009, we recognized a $1.1 billion
pretax gain related to BlackRock’s acquisition of Barclays
Global Investors (BGI).
Asset management revenue was $1.1 billion in 2010 compared
with $858 million in 2009. This increase reflected higher
equity earnings from our BlackRock investment, improved
equity markets and client growth. Discretionary assets under
management at December 31, 2010 totaled $108 billion
compared with $103 billion at December 31, 2009.
Consumer services fees totaled $1.3 billion in both 2010 and
2009. Consumer service fees for 2010 reflected higher
volume-related transaction fees offset by lower brokerage fees
and the impact of the January 1, 2010 consolidation of the
securitized credit card portfolio.
Corporate services revenue totaled $1.1 billion in 2010 and
$1.0 billion in 2009. The increase was largely the result of
higher merger and acquisition advisory and ancillary
commercial mortgage servicing fees partially offset by a
reduction in the value of commercial mortgage servicing
rights largely driven by lower interest rates. Corporate
services fees include the noninterest component of treasury
management fees, which continued to be a strong contributor
to revenue.
Residential mortgage revenue totaled $699 million in 2010
compared with $990 million in 2009. The decline in 2010
reflected reduced loan sales revenue following the strong loan
origination refinance volume in 2009 and lower net hedging
gains on mortgage servicing rights.
There were lower service charges on deposits of $245 million
in 2010 compared with 2009, partially resulting from the
negative impact of the new Regulation E rules.
Net securities gains increased by $128 million in 2010
compared with 2009 due to lower net credit related OTTI
partially offset by lower gains on sales of securities.
Gains on BlackRock related transactions included a fourth
quarter 2010 pretax gain of $160 million from our sale of
7.5 million BlackRock common shares as part of a BlackRock
secondary common stock offering. During the fourth quarter
of 2009, we recognized a $1.1 billion pretax gain on PNC’s
portion of the increase in BlackRock’s equity resulting from
the value of BlackRock shares issued by BlackRock in
connection with its acquisition of BGI.
Other noninterest income totaled $884 million for 2010
compared with $987 million for 2009. Other noninterest
income for 2009 included gains of $103 million primarily
related to our BlackRock LTIP shares obligation. Other
noninterest income for 2010 included net gains on alternative
investments, including private equity, of $258 million,
compared with net losses on alternative investments, including
private equity, of $93 million in 2009. Gains on sales of loans
were $73 million in 2010 and $220 million in 2009.
Provision For Credit Losses
The provision for credit losses totaled $2.5 billion for 2010
compared with $3.9 billion for 2009. The lower provision in
2010 reflected credit exposure reductions and overall
improved credit migration during 2010.
Noninterest Expense
Noninterest expense for 2010 declined 5%, to $8.6 billion,
compared with $9.1 billion for 2009. The impact of higher
cost savings related to the National City acquisition
integration and the reversal of certain accrued liabilities in
2010, including $73 million associated with a franchise tax
settlement and $123 million associated with an
indemnification liability for certain Visa litigation, were
reflected in the lower 2010 expenses. Lower expenses in the
comparison also reflected a special FDIC assessment,
intended to build the FDIC’s Deposit Insurance Fund, of $133
million in 2009. We also continued to invest in customer
growth and innovation initiatives.
The PNC Financial Services Group, Inc. – Form 10-K 93