PNC Bank 2011 Annual Report Download - page 195
Download and view the complete annual report
Please find page 195 of the 2011 PNC Bank annual report below. You can navigate through the pages in the report by either clicking on the pages listed below, or by using the keyword search tool below to find specific information within the annual report.-
 1
1 -
2
-
3
-
4
-
5
-
6
-
7
-
8
-
9
-
10
-
11
-
12
-
13
-
14
-
15
-
16
-
17
-
18
-
19
-
20
-
21
-
22
-
23
-
24
-
25
-
26
-
27
-
28
-
29
-
30
-
31
-
32
-
33
-
34
-
35
-
36
-
37
-
38
-
39
-
40
-
41
-
42
-
43
-
44
-
45
-
46
-
47
-
48
-
49
-
50
-
51
-
52
-
53
-
54
-
55
-
56
-
57
-
58
-
59
-
60
-
61
-
62
-
63
-
64
-
65
-
66
-
67
-
68
-
69
-
70
-
71
-
72
-
73
-
74
-
75
-
76
-
77
-
78
-
79
-
80
-
81
-
82
-
83
-
84
-
85
-
86
-
87
-
88
-
89
-
90
-
91
-
92
-
93
-
94
-
95
-
96
-
97
-
98
-
99
-
100
-
101
-
102
-
103
-
104
-
105
-
106
-
107
-
108
-
109
-
110
-
111
-
112
-
113
-
114
-
115
-
116
-
117
-
118
-
119
-
120
-
121
-
122
-
123
-
124
-
125
-
126
-
127
-
128
-
129
-
130
-
131
-
132
-
133
-
134
-
135
-
136
-
137
-
138
-
139
-
140
-
141
-
142
-
143
-
144
-
145
-
146
-
147
-
148
-
149
-
150
-
151
-
152
-
153
-
154
-
155
-
156
-
157
-
158
-
159
-
160
-
161
-
162
-
163
-
164
-
165
-
166
-
167
-
168
-
169
-
170
-
171
-
172
-
173
-
174
-
175
-
176
-
177
-
178
-
179
-
180
-
181
-
182
-
183
-
184
-
 185
185 -
 186
186 -
 187
187 -
 188
188 -
 189
189 -
 190
190 -
 191
191 -
 192
192 -
 193
193 -
 194
194 -
 195
195 -
 196
196 -
 197
197 -
 198
198 -
 199
199 -
 200
200 -
 201
201 -
 202
202 -
 203
203 -
 204
204 -
 205
205 -
206
-
207
-
208
-
209
-
210
-
211
-
212
-
213
-
214
-
215
-
216
-
217
-
218
-
219
-
220
-
221
-
222
-
223
-
224
-
225
-
226
-
227
-
228
-
229
-
230
-
231
-
232
-
233
-
234
-
235
-
236
-
237
-
238
 |
 |

N
OTE
19 O
THER
C
OMPREHENSIVE
I
NCOME
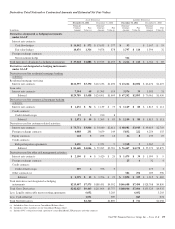
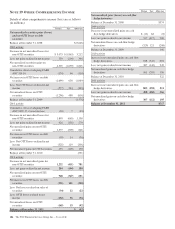
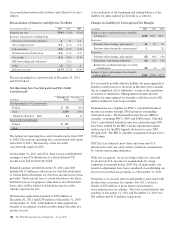
Details of other comprehensive income (loss) are as follows
(in millions):
Pretax Tax After-tax
Net unrealized securities gains (losses)
and net OTTI losses on debt
securities
Balance at December 31, 2008 $(3,626)
2009 activity
Decrease in net unrealized losses for
non-OTTI securities $ 5,075 $(1,863) 3,212
Less: net gains realized in net income 550 (204) 346
Net unrealized securities gains on
non-OTTI securities 4,525 (1,659) 2,866
Cumulative effect of adopting FASB
ASC 320-10 (174) 64 (110)
Net increase in OTTI losses on debt
securities (1,699) 630 (1,069)
Less: Net OTTI losses realized in net
income (577) 214 (363)
Net unrealized losses on OTTI
securities (1,296) 480 (816)
Balance at December 31, 2009 (1,576)
2010 activity
Cumulative effect of adopting FASB
ASU 2009-17, Consolidations (20) 7 (13)
Decrease in net unrealized losses for
non-OTTI securities 1,803 (665) 1,138
Less: net gains realized in net income 426 (156) 270
Net unrealized gains on non-OTTI
securities 1,377 (509) 868
Net increase in OTTI losses on debt
securities (50) 14 (36)
Less: Net OTTI losses realized in net
income (325) 119 (206)
Net unrealized gains on OTTI securities 275 (105) 170
Balance at December 31, 2010 (551)
2011 activity
Decrease in net unrealized gains for
non-OTTI securities 1,232 (451) 781
Less: net gains realized in net income 284 (104) 180
Net unrealized gains on non-OTTI
securities 948 (347) 601
Net increase in OTTI losses on debt
securities (331) 121 (210)
Less: Net losses realized on sales of
securities (34) 12 (22)
Less: OTTI losses realized in net
income (152) 56 (96)
Net unrealized losses on OTTI
securities (145) 53 (92)
Balance at December 31, 2011 $ (42)
Pretax Tax After-tax
Net unrealized gains (losses) on cash flow
hedge derivatives
Balance at December 31, 2008 $374
2009 activity
Decrease in net unrealized gains on cash
flow hedge derivatives $ (12) $4 (8)
Less: net gains realized in net income 317 (117) 200
Net unrealized losses on cash flow hedge
derivatives (329) 121 (208)
Balance at December 31, 2009 166
2010 activity
Increase in net unrealized gains on cash flow
hedge derivatives 948 (347) 601
Less: net gains realized in net income 387 (142) 245
Net unrealized gains on cash flow hedge
derivatives 561 (205) 356
Balance at December 31, 2010 522
2011 activity
Increase in net unrealized gains on cash flow
hedge derivatives 805 (294) 511
Less: net gains realized in net income 498 (182) 316
Net unrealized gains on cash flow hedge
derivatives 307 (112) 195
Balance at December 31, 2011 $717
186 The PNC Financial Services Group, Inc. – Form 10-K