PNC Bank 2011 Annual Report Download - page 192
Download and view the complete annual report
Please find page 192 of the 2011 PNC Bank annual report below. You can navigate through the pages in the report by either clicking on the pages listed below, or by using the keyword search tool below to find specific information within the annual report.-
 1
1 -
2
-
3
-
4
-
5
-
6
-
7
-
8
-
9
-
10
-
11
-
12
-
13
-
14
-
15
-
16
-
17
-
18
-
19
-
20
-
21
-
22
-
23
-
24
-
25
-
26
-
27
-
28
-
29
-
30
-
31
-
32
-
33
-
34
-
35
-
36
-
37
-
38
-
39
-
40
-
41
-
42
-
43
-
44
-
45
-
46
-
47
-
48
-
49
-
50
-
51
-
52
-
53
-
54
-
55
-
56
-
57
-
58
-
59
-
60
-
61
-
62
-
63
-
64
-
65
-
66
-
67
-
68
-
69
-
70
-
71
-
72
-
73
-
74
-
75
-
76
-
77
-
78
-
79
-
80
-
81
-
82
-
83
-
84
-
85
-
86
-
87
-
88
-
89
-
90
-
91
-
92
-
93
-
94
-
95
-
96
-
97
-
98
-
99
-
100
-
101
-
102
-
103
-
104
-
105
-
106
-
107
-
108
-
109
-
110
-
111
-
112
-
113
-
114
-
115
-
116
-
117
-
118
-
119
-
120
-
121
-
122
-
123
-
124
-
125
-
126
-
127
-
128
-
129
-
130
-
131
-
132
-
133
-
134
-
135
-
136
-
137
-
138
-
139
-
140
-
141
-
142
-
143
-
144
-
145
-
146
-
147
-
148
-
149
-
150
-
151
-
152
-
153
-
154
-
155
-
156
-
157
-
158
-
159
-
160
-
161
-
162
-
163
-
164
-
165
-
166
-
167
-
168
-
169
-
170
-
171
-
172
-
173
-
174
-
175
-
176
-
177
-
178
-
179
-
180
-
181
-
 182
182 -
 183
183 -
 184
184 -
 185
185 -
 186
186 -
 187
187 -
 188
188 -
 189
189 -
 190
190 -
 191
191 -
 192
192 -
 193
193 -
 194
194 -
 195
195 -
 196
196 -
 197
197 -
 198
198 -
 199
199 -
 200
200 -
 201
201 -
 202
202 -
203
-
204
-
205
-
206
-
207
-
208
-
209
-
210
-
211
-
212
-
213
-
214
-
215
-
216
-
217
-
218
-
219
-
220
-
221
-
222
-
223
-
224
-
225
-
226
-
227
-
228
-
229
-
230
-
231
-
232
-
233
-
234
-
235
-
236
-
237
-
238
 |
 |

N
OTE
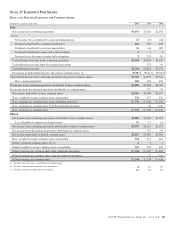
17 E
ARNINGS
P
ER
S
HARE
B
ASIC AND
D
ILUTED
E
ARNINGS PER
C
OMMON
S
HARE
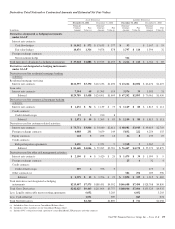
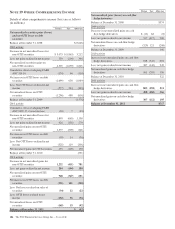
In millions, except per share data 2011 2010 2009
Basic
Net income from continuing operations $3,071 $3,024 $2,358
Less:
Net income (loss) attributable to noncontrolling interests 15 (15) (44)
Dividends distributed to common shareholders 602 203 428
Dividends distributed to preferred shareholders 56 146 388
Dividends distributed to nonvested restricted shares 211
Preferred stock discount accretion and redemptions 2255 56
Undistributed net income from continuing operations $2,394 $2,434 $1,529
Undistributed net income from discontinued operations 373 45
Undistributed net income $2,394 $2,807 $1,574
Percentage of undistributed income allocated to common shares (a) 99.58 % 99.64 % 99.68 %
Undistributed income from continuing operations allocated to common shares $2,384 $2,425 $1,524
Plus: common dividends 602 203 428
Net income from continuing operations attributable to basic common shares $2,986 $2,628 $1,952
Net income from discontinued operations attributable to common shares 372 45
Net income attributable to basic common shares $2,986 $3,000 $1,997
Basic weighted-average common shares outstanding 524 517 454
Basic earnings per common share from continuing operations $ 5.70 $ 5.08 $ 4.30
Basic earnings per common share from discontinued operations .72 0.10
Basic earnings per common share $ 5.70 $ 5.80 $ 4.40
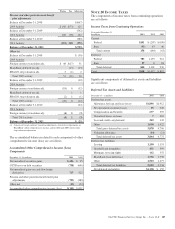
Diluted
Net income from continuing operations attributable to basic common shares $2,986 $2,628 $1,952
Less: BlackRock common stock equivalents 19 17 15
Net income from continuing operations attributable to diluted common shares $2,967 $2,611 $1,937
Net income from discontinued operations attributable to common shares 372 45
Net income attributable to diluted common shares $2,967 $2,983 $1,982
Basic weighted-average common shares outstanding 524 517 454
Dilutive potential common shares (b) (c) 231
Diluted weighted-average common shares outstanding 526 520 455
Diluted earnings per common share from continuing operations $ 5.64 $ 5.02 $ 4.26
Diluted earnings per common share from discontinued operations .72 0.10
Diluted earnings per common share $ 5.64 $ 5.74 $ 4.36
(a) Excludes unvested shares issued for Restricted Stock plans
(b) Excludes stock options considered to be anti-dilutive 811 15
(c) Excludes warrants considered to be anti-dilutive 17 22 22
The PNC Financial Services Group, Inc. – Form 10-K 183