PNC Bank 2011 Annual Report Download - page 90
Download and view the complete annual report
Please find page 90 of the 2011 PNC Bank annual report below. You can navigate through the pages in the report by either clicking on the pages listed below, or by using the keyword search tool below to find specific information within the annual report.-
 1
1 -
2
-
3
-
4
-
5
-
6
-
7
-
8
-
9
-
10
-
11
-
12
-
13
-
14
-
15
-
16
-
17
-
18
-
19
-
20
-
21
-
22
-
23
-
24
-
25
-
26
-
27
-
28
-
29
-
30
-
31
-
32
-
33
-
34
-
35
-
36
-
37
-
38
-
39
-
40
-
41
-
42
-
43
-
44
-
45
-
46
-
47
-
48
-
49
-
50
-
51
-
52
-
53
-
54
-
55
-
56
-
57
-
58
-
59
-
60
-
61
-
62
-
63
-
64
-
65
-
66
-
67
-
68
-
69
-
70
-
71
-
72
-
73
-
74
-
75
-
76
-
77
-
78
-
79
-
 80
80 -
 81
81 -
 82
82 -
 83
83 -
 84
84 -
 85
85 -
 86
86 -
 87
87 -
 88
88 -
 89
89 -
 90
90 -
 91
91 -
 92
92 -
 93
93 -
 94
94 -
 95
95 -
 96
96 -
 97
97 -
 98
98 -
 99
99 -
 100
100 -
101
-
102
-
103
-
104
-
105
-
106
-
107
-
108
-
109
-
110
-
111
-
112
-
113
-
114
-
115
-
116
-
117
-
118
-
119
-
120
-
121
-
122
-
123
-
124
-
125
-
126
-
127
-
128
-
129
-
130
-
131
-
132
-
133
-
134
-
135
-
136
-
137
-
138
-
139
-
140
-
141
-
142
-
143
-
144
-
145
-
146
-
147
-
148
-
149
-
150
-
151
-
152
-
153
-
154
-
155
-
156
-
157
-
158
-
159
-
160
-
161
-
162
-
163
-
164
-
165
-
166
-
167
-
168
-
169
-
170
-
171
-
172
-
173
-
174
-
175
-
176
-
177
-
178
-
179
-
180
-
181
-
182
-
183
-
184
-
185
-
186
-
187
-
188
-
189
-
190
-
191
-
192
-
193
-
194
-
195
-
196
-
197
-
198
-
199
-
200
-
201
-
202
-
203
-
204
-
205
-
206
-
207
-
208
-
209
-
210
-
211
-
212
-
213
-
214
-
215
-
216
-
217
-
218
-
219
-
220
-
221
-
222
-
223
-
224
-
225
-
226
-
227
-
228
-
229
-
230
-
231
-
232
-
233
-
234
-
235
-
236
-
237
-
238
 |
 |

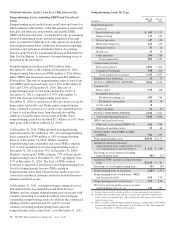
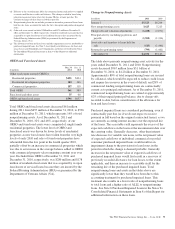
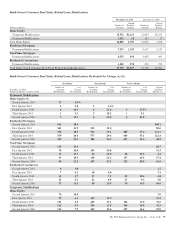
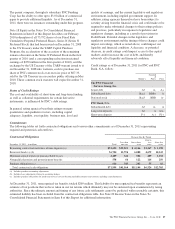
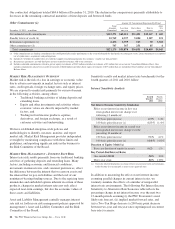
Summary of Troubled Debt Restructurings
In millions
Dec. 31
2011
Dec. 31
2010
Consumer lending:
Real estate-related $1,492 $1,087
Credit card (a) 291 331
Other consumer 15 4
Total consumer lending 1,798 1,422
Total commercial lending 405 236
Total TDRs $2,203 $1,658
Nonperforming $1,141 $ 784
Accruing (b) 771 543
Credit card (a) 291 331
Total TDRs $2,203 $1,658
(a) Includes credit cards and certain small business and consumer credit agreements
whose terms have been restructured and are TDRs. However, since our policy is to
exempt these loans from being placed on nonaccrual status as permitted by
regulatory guidance as generally these loans are directly charged off in the period
that they become 180 days past due, these loans are excluded from nonperforming
loans.
(b) Accruing loans have demonstrated a period of at least six months of performance
under the restructured terms and are excluded from nonperforming loans.
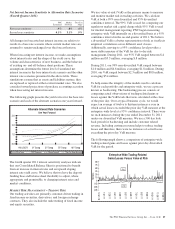
Total TDRs increased $545 million or 33% during 2011 to
$2.2 billion as of December 31, 2011. Of this total,
nonperforming TDRs totaled $1.1 billion, which represents
approximately 32% of total nonperforming loans. However, as
the economy has continued to slowly improve, the amount of
TDRs returning to performing status has been increasing as
noted below.
TDRs that have returned to performing (accruing) status are
excluded from nonperforming loans. These loans have
demonstrated a period of at least six months of consecutive
performance under the restructured terms. These TDRs
increased $228 million or 42% during 2011 to $771 million as
of December 31, 2011. This increase reflects the further
seasoning and performance of the TDRs. See Note 5 Asset
Quality and Allowances for Loan and Lease Losses and
Unfunded Loan Commitments and Letters of Credit in the
Notes To Consolidated Financial Statements in Item 8 of this
Report for additional information.
A
LLOWANCES
F
OR
L
OAN
A
ND
L
EASE
L
OSSES
A
ND
U
NFUNDED
L
OAN
C
OMMITMENTS
A
ND
L
ETTERS
O
F
C
REDIT
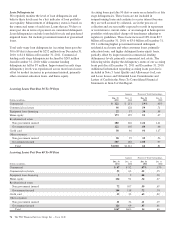
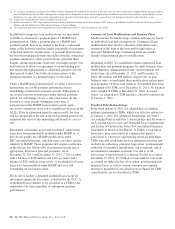
We recorded $1.6 billion in net charge-offs for the full year of
2011, compared to $2.9 billion in the full year of 2010.
Commercial lending net charge-offs fell from $1.6 billion in
the full year of 2010 to $712 million in the full year of 2011.
Consumer lending net charge-offs declined from $1.3 billion
in the full year of 2010 to $927 million in the full year of
2011.
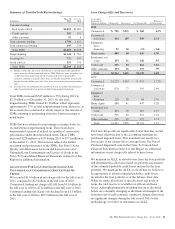
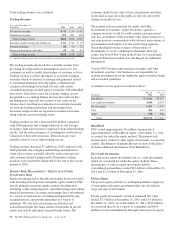
Loan Charge-Offs And Recoveries
Year ended
December 31
Dollars in millions Charge-offs Recoveries Net Charge-offs
Percent of
Average Loans
2011
Commercial $ 700 $332 $ 368 .62%
Commercial
real estate 464 105 359 2.14
Equipment
lease
financing 35 50 (15) (.24)
Home equity 484 48 436 1.30
Residential real
estate 153 11 142 .95
Credit card 235 23 212 5.62
Other consumer 193 56 137 .79
Total $2,264 $625 $1,639 1.08
2010
Commercial $1,227 $294 $ 933 1.72%
Commercial
real estate 670 77 593 2.90
Equipment
lease
financing 120 56 64 1.02
Home equity 488 41 447 1.28
Residential real
estate 406 19 387 2.19
Credit card 335 20 315 7.94
Other consumer 246 49 197 1.74
Total $3,492 $556 $2,936 1.91
Total net charge-offs are significantly lower than they would
have been otherwise due to the accounting treatment for
purchased impaired loans. This treatment also results in a
lower ratio of net charge-offs to average loans. See Note 6
Purchased Impaired Loans in the Notes To Consolidated
Financial Statements in Item 8 of this Report for additional
information on net charge-offs related to these loans.
We maintain an ALLL to absorb losses from the loan portfolio
and determine this allowance based on quarterly assessments
of the estimated probable credit losses incurred in the loan
portfolio. We maintain the ALLL at a level that we believe to
be appropriate to absorb estimated probable credit losses
incurred in the loan portfolio as of the balance sheet date.
While we make allocations to specific loans and pools of
loans, the total reserve is available for all loan and lease
losses. Although quantitative modeling factors as discussed
below are constantly changing as the financial strength of the
borrower and overall economic conditions change, there were
no significant changes during the full year of 2011 to the
methodology we follow to determine our ALLL.
The PNC Financial Services Group, Inc. – Form 10-K 81