PNC Bank 2011 Annual Report Download - page 171
Download and view the complete annual report
Please find page 171 of the 2011 PNC Bank annual report below. You can navigate through the pages in the report by either clicking on the pages listed below, or by using the keyword search tool below to find specific information within the annual report.-
 1
1 -
2
-
3
-
4
-
5
-
6
-
7
-
8
-
9
-
10
-
11
-
12
-
13
-
14
-
15
-
16
-
17
-
18
-
19
-
20
-
21
-
22
-
23
-
24
-
25
-
26
-
27
-
28
-
29
-
30
-
31
-
32
-
33
-
34
-
35
-
36
-
37
-
38
-
39
-
40
-
41
-
42
-
43
-
44
-
45
-
46
-
47
-
48
-
49
-
50
-
51
-
52
-
53
-
54
-
55
-
56
-
57
-
58
-
59
-
60
-
61
-
62
-
63
-
64
-
65
-
66
-
67
-
68
-
69
-
70
-
71
-
72
-
73
-
74
-
75
-
76
-
77
-
78
-
79
-
80
-
81
-
82
-
83
-
84
-
85
-
86
-
87
-
88
-
89
-
90
-
91
-
92
-
93
-
94
-
95
-
96
-
97
-
98
-
99
-
100
-
101
-
102
-
103
-
104
-
105
-
106
-
107
-
108
-
109
-
110
-
111
-
112
-
113
-
114
-
115
-
116
-
117
-
118
-
119
-
120
-
121
-
122
-
123
-
124
-
125
-
126
-
127
-
128
-
129
-
130
-
131
-
132
-
133
-
134
-
135
-
136
-
137
-
138
-
139
-
140
-
141
-
142
-
143
-
144
-
145
-
146
-
147
-
148
-
149
-
150
-
151
-
152
-
153
-
154
-
155
-
156
-
157
-
158
-
159
-
160
-
 161
161 -
 162
162 -
 163
163 -
 164
164 -
 165
165 -
 166
166 -
 167
167 -
 168
168 -
 169
169 -
 170
170 -
 171
171 -
 172
172 -
 173
173 -
 174
174 -
 175
175 -
 176
176 -
 177
177 -
 178
178 -
 179
179 -
 180
180 -
 181
181 -
182
-
183
-
184
-
185
-
186
-
187
-
188
-
189
-
190
-
191
-
192
-
193
-
194
-
195
-
196
-
197
-
198
-
199
-
200
-
201
-
202
-
203
-
204
-
205
-
206
-
207
-
208
-
209
-
210
-
211
-
212
-
213
-
214
-
215
-
216
-
217
-
218
-
219
-
220
-
221
-
222
-
223
-
224
-
225
-
226
-
227
-
228
-
229
-
230
-
231
-
232
-
233
-
234
-
235
-
236
-
237
-
238
 |
 |

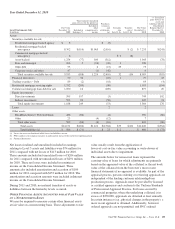
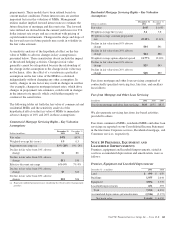
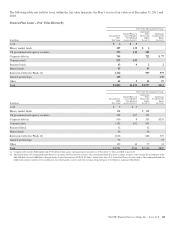
Depreciation expense on premises, equipment and leasehold
improvements and amortization expense, primarily for
capitalized internally developed software, was as follows:
Depreciation and Amortization Expense
Year ended December 31
in millions 2011 2010 2009
Continuing operations:
Depreciation $474 $455 $466
Amortization 22 45 79
Discontinued operations:
Depreciation 12 29
Amortization 11 26
We lease certain facilities and equipment under agreements
expiring at various dates through the year 2067. We account
for these as operating leases. Rental expense on such leases
was as follows:
Lease Rental Expense
Year ended December 31
in millions 2011 2010 2009
Continuing operations: $357 $379 $372
Discontinued operations: 10 16
Required minimum annual rentals that we owe on
noncancelable leases having initial or remaining terms in
excess of one year totaled $2.5 billion at December 31, 2011.
Future minimum annual rentals are as follows:
• 2012: $342 million,
• 2013: $312 million,
• 2014: $274 million,
• 2015: $221 million,
• 2016: $188 million, and
• 2017 and thereafter: $1.2 billion.
N
OTE
11 T
IME
D
EPOSITS
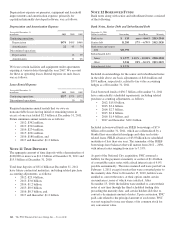
The aggregate amount of time deposits with a denomination of
$100,000 or more was $11.2 billion at December 31, 2011 and
$15.5 billion at December 31, 2010.
Total time deposits of $31.6 billion at December 31, 2011
have future contractual maturities, including related purchase
accounting adjustments, as follows:
• 2012: $25.0 billion,
• 2013: $3.0 billion,
• 2014: $1.2 billion,
• 2015: $0.9 billion,
• 2016: $0.3 billion, and
• 2017 and thereafter: $1.2 billion.
N
OTE
12 B
ORROWED
F
UNDS
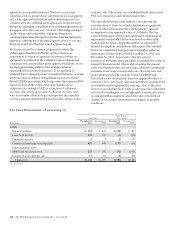
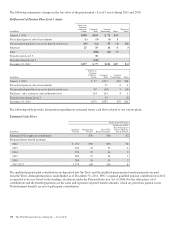
Bank notes along with senior and subordinated notes consisted
of the following:
Bank Notes, Senior Debt and Subordinated Debt
December 31, 2011
Dollars in millions Outstanding Stated Rate Maturity
Bank notes $ 510 zero – 4.66% 2013-2043
Senior debt 11,283 .57% – 6.70% 2012-2020
Bank notes and senior
debt $11,793
Subordinated debt
Junior $ 2,377 1.10% – 10.18% 2028-2068
Other 5,944 .90% – 8.11% 2013-2019
Subordinated debt $ 8,321
Included in outstandings for the senior and subordinated notes
in the table above are basis adjustments of $434 million and
$591 million, respectively, related to fair value accounting
hedges as of December 31, 2011.
Total borrowed funds of $36.7 billion at December 31, 2011
have contractually scheduled repayments, including related
purchase accounting adjustments, as follows:
• 2012: $15.8 billion,
• 2013: $3.4 billion,
• 2014: $2.7 billion,
• 2015: $2.8 billion,
• 2016: $1.9 billion, and
• 2017 and thereafter: $10.1 billion.
Included in borrowed funds are FHLB borrowings of $7.0
billion at December 31, 2011, which are collateralized by a
blanket lien on residential mortgage and other real estate-
related loans. FHLB advances of $3.0 billion have scheduled
maturities of less than one year. The remainder of the FHLB
borrowings have balances that will mature from 2012 – 2030,
with interest rates ranging from zero to 7.33%.
As part of the National City acquisition, PNC assumed a
liability for the payment at maturity or earlier of $1.4 billion
of convertible senior notes with a fixed interest rate of 4.0%
payable semiannually. The notes matured and were paid off on
February 1, 2011 except for notes that were converted prior to
the maturity date. Prior to November 15, 2010, holders were
entitled to convert the notes, at their option, under certain
circumstances, none of which were satisfied. After
November 15, 2010, the holders were entitled to convert their
notes at any time through the third scheduled trading date
preceding the maturity date, and certain holders did elect to
convert a de minimis amount of notes. Upon conversion, PNC
paid cash related to the principal amount of such notes. PNC
was not required to issue any shares of its common stock for
any conversion value.
162 The PNC Financial Services Group, Inc. – Form 10-K