PNC Bank 2011 Annual Report Download - page 183
Download and view the complete annual report
Please find page 183 of the 2011 PNC Bank annual report below. You can navigate through the pages in the report by either clicking on the pages listed below, or by using the keyword search tool below to find specific information within the annual report.-
 1
1 -
2
-
3
-
4
-
5
-
6
-
7
-
8
-
9
-
10
-
11
-
12
-
13
-
14
-
15
-
16
-
17
-
18
-
19
-
20
-
21
-
22
-
23
-
24
-
25
-
26
-
27
-
28
-
29
-
30
-
31
-
32
-
33
-
34
-
35
-
36
-
37
-
38
-
39
-
40
-
41
-
42
-
43
-
44
-
45
-
46
-
47
-
48
-
49
-
50
-
51
-
52
-
53
-
54
-
55
-
56
-
57
-
58
-
59
-
60
-
61
-
62
-
63
-
64
-
65
-
66
-
67
-
68
-
69
-
70
-
71
-
72
-
73
-
74
-
75
-
76
-
77
-
78
-
79
-
80
-
81
-
82
-
83
-
84
-
85
-
86
-
87
-
88
-
89
-
90
-
91
-
92
-
93
-
94
-
95
-
96
-
97
-
98
-
99
-
100
-
101
-
102
-
103
-
104
-
105
-
106
-
107
-
108
-
109
-
110
-
111
-
112
-
113
-
114
-
115
-
116
-
117
-
118
-
119
-
120
-
121
-
122
-
123
-
124
-
125
-
126
-
127
-
128
-
129
-
130
-
131
-
132
-
133
-
134
-
135
-
136
-
137
-
138
-
139
-
140
-
141
-
142
-
143
-
144
-
145
-
146
-
147
-
148
-
149
-
150
-
151
-
152
-
153
-
154
-
155
-
156
-
157
-
158
-
159
-
160
-
161
-
162
-
163
-
164
-
165
-
166
-
167
-
168
-
169
-
170
-
171
-
172
-
 173
173 -
 174
174 -
 175
175 -
 176
176 -
 177
177 -
 178
178 -
 179
179 -
 180
180 -
 181
181 -
 182
182 -
 183
183 -
 184
184 -
 185
185 -
 186
186 -
 187
187 -
 188
188 -
 189
189 -
 190
190 -
 191
191 -
 192
192 -
 193
193 -
194
-
195
-
196
-
197
-
198
-
199
-
200
-
201
-
202
-
203
-
204
-
205
-
206
-
207
-
208
-
209
-
210
-
211
-
212
-
213
-
214
-
215
-
216
-
217
-
218
-
219
-
220
-
221
-
222
-
223
-
224
-
225
-
226
-
227
-
228
-
229
-
230
-
231
-
232
-
233
-
234
-
235
-
236
-
237
-
238
 |
 |

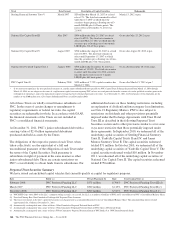
There were no options granted in excess of market value in
2011, 2010 or 2009. Shares of common stock available during
the next year for the granting of options and other awards
under the Incentive Plans were 33,775,543 at December 31,
2011. Total shares of PNC common stock authorized for
future issuance under equity compensation plans totaled
35,304,422 shares at December 31, 2011, which includes
shares available for issuance under the Incentive Plans and the
Employee Stock Purchase Plan (ESPP) as described below.
During 2011, we issued 731,336 shares from treasury stock in
connection with stock option exercise activity. As with past
exercise activity, we currently intend to utilize primarily
treasury stock for any future stock option exercises.
Awards granted to non-employee directors in 2011, 2010 and
2009 include 27,090, 29,040, and 39,552 deferred stock units,
respectively, awarded under the Outside Directors Deferred
Stock Unit Plan. A deferred stock unit is a phantom share of
our common stock, which requires liability accounting
treatment until such awards are paid to the participants as
cash. As there are no vesting or service requirements on these
awards, total compensation expense is recognized in full on
awarded deferred stock units on the date of grant.
I
NCENTIVE
/P
ERFORMANCE
U
NIT
S
HARE
A
WARDS
A
ND
R
ESTRICTED
S
TOCK
/U
NIT
A
WARDS
The fair value of nonvested incentive/performance unit share
awards and restricted stock/unit awards is initially determined
based on prices not less than the market value of our common
stock price on the date of grant. The value of certain incentive/
performance unit share awards is subsequently remeasured
based on the achievement of one or more financial and other
performance goals generally over a three-year period. The
Personnel and Compensation Committee of the Board of
Directors approves the final award payout with respect to
incentive/performance unit share awards. Restricted stock/unit
awards have various vesting periods generally ranging from
36 months to 60 months.
Beginning in 2011, we incorporated two changes to certain
awards under our existing long-term incentive compensation
programs. First, for certain grants of incentive performance
units, the future payout amount will be subject to a negative
annual adjustment if PNC fails to meet certain risk-related
performance metrics. This adjustment is in addition to the
existing financial performance metrics relative to our peers.
These grants have a three-year performance period and are
payable in either stock or a combination of stock and cash.
Second, performance-based restricted share units
(performance RSUs) were granted in 2011 to certain of our
executives in lieu of stock options. These performance RSUs
(which are payable solely in stock) have a service condition,
an internal risk-related performance condition, and an external
market condition. Satisfaction of the performance condition is
based on four independent one-year performance periods.
The weighted-average grant-date fair value of incentive/
performance unit share awards and restricted stock/unit
awards granted in 2011, 2010 and 2009 was $63.25, $54.59
and $41.16 per share, respectively. We recognize
compensation expense for such awards ratably over the
corresponding vesting and/or performance periods for each
type of program.
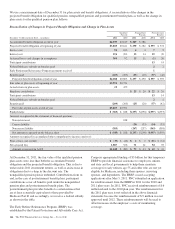
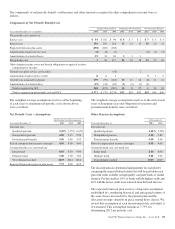
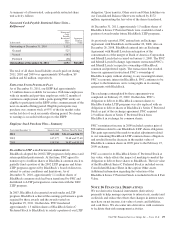
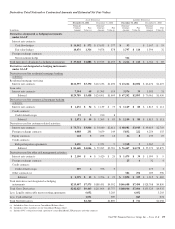
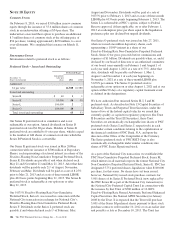
Nonvested Incentive/Performance Unit Share Awards and
Restricted Stock/Unit Awards – Rollforward
Shares in thousands
Nonvested
Incentive/
Performance
Unit Shares
Weighted-
Average
Grant
Date Fair
Value
Nonvested
Restricted
Stock/
Unit
Shares
Weighted-
Average
Grant
Date Fair
Value
December 31, 2010 363 $56.40 2,250 $49.95
Granted 623 64.21 1,059 62.68
Vested (156) 59.54 (706) 51.27
Forfeited (91) 52.24
December 31, 2011 830 $61.68 2,512 $54.87
In the chart above, the unit shares and related weighted-
average grant-date fair value of the incentive/performance
awards exclude the effect of dividends on the underlying
shares, as those dividends will be paid in cash.
At December 31, 2011, there was $61 million of unrecognized
deferred compensation expense related to nonvested share-
based compensation arrangements granted under the Incentive
Plans. This cost is expected to be recognized as expense over a
period of no longer than five years. The total fair value of
incentive/performance unit share and restricted stock/unit
awards vested during 2011, 2010 and 2009 was approximately
$52 million, $39 million and $47 million, respectively.
L
IABILITY
A
WARDS
We grant annually cash-payable restricted share units to
certain executives. The grants were made primarily as part of
an annual bonus incentive deferral plan. While there are time-
based and service-related vesting criteria, there are no market
or performance criteria associated with these awards.
Compensation expense recognized related to these awards was
recorded in prior periods as part of annual cash bonus criteria.
As of December 31, 2011, there were 753,203 of these cash-
payable restricted share units outstanding.
174 The PNC Financial Services Group, Inc. – Form 10-K