PNC Bank 2011 Annual Report Download - page 215
Download and view the complete annual report
Please find page 215 of the 2011 PNC Bank annual report below. You can navigate through the pages in the report by either clicking on the pages listed below, or by using the keyword search tool below to find specific information within the annual report.-
 1
1 -
2
-
3
-
4
-
5
-
6
-
7
-
8
-
9
-
10
-
11
-
12
-
13
-
14
-
15
-
16
-
17
-
18
-
19
-
20
-
21
-
22
-
23
-
24
-
25
-
26
-
27
-
28
-
29
-
30
-
31
-
32
-
33
-
34
-
35
-
36
-
37
-
38
-
39
-
40
-
41
-
42
-
43
-
44
-
45
-
46
-
47
-
48
-
49
-
50
-
51
-
52
-
53
-
54
-
55
-
56
-
57
-
58
-
59
-
60
-
61
-
62
-
63
-
64
-
65
-
66
-
67
-
68
-
69
-
70
-
71
-
72
-
73
-
74
-
75
-
76
-
77
-
78
-
79
-
80
-
81
-
82
-
83
-
84
-
85
-
86
-
87
-
88
-
89
-
90
-
91
-
92
-
93
-
94
-
95
-
96
-
97
-
98
-
99
-
100
-
101
-
102
-
103
-
104
-
105
-
106
-
107
-
108
-
109
-
110
-
111
-
112
-
113
-
114
-
115
-
116
-
117
-
118
-
119
-
120
-
121
-
122
-
123
-
124
-
125
-
126
-
127
-
128
-
129
-
130
-
131
-
132
-
133
-
134
-
135
-
136
-
137
-
138
-
139
-
140
-
141
-
142
-
143
-
144
-
145
-
146
-
147
-
148
-
149
-
150
-
151
-
152
-
153
-
154
-
155
-
156
-
157
-
158
-
159
-
160
-
161
-
162
-
163
-
164
-
165
-
166
-
167
-
168
-
169
-
170
-
171
-
172
-
173
-
174
-
175
-
176
-
177
-
178
-
179
-
180
-
181
-
182
-
183
-
184
-
185
-
186
-
187
-
188
-
189
-
190
-
191
-
192
-
193
-
194
-
195
-
196
-
197
-
198
-
199
-
200
-
201
-
202
-
203
-
204
-
 205
205 -
 206
206 -
 207
207 -
 208
208 -
 209
209 -
 210
210 -
 211
211 -
 212
212 -
 213
213 -
 214
214 -
 215
215 -
 216
216 -
 217
217 -
 218
218 -
 219
219 -
 220
220 -
 221
221 -
 222
222 -
 223
223 -
 224
224 -
 225
225 -
226
-
227
-
228
-
229
-
230
-
231
-
232
-
233
-
234
-
235
-
236
-
237
-
238
 |
 |

S
TATISTICAL
I
NFORMATION
(U
NAUDITED
)
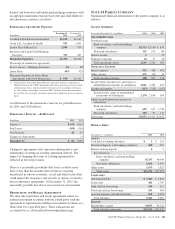
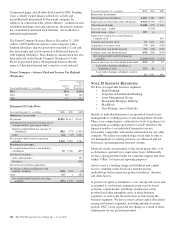
THE PNC FINANCIAL SERVICES GROUP, INC.
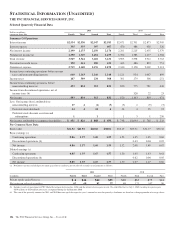
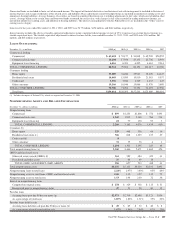
Selected Quarterly Financial Data
Dollars in millions,
except per share data
2011 2010
Fourth Third Second First Fourth Third Second First
Summary Of Operations
Interest income $2,534 $2,530 $2,547 $2,583 $2,671 $2,701 $2,873 $2,905
Interest expense 335 355 397 407 470 486 438 526
Net interest income 2,199 2,175 2,150 2,176 2,201 2,215 2,435 2,379
Noninterest income (a) 1,350 1,369 1,452 1,455 1,702 1,383 1,477 1,384
Total revenue 3,549 3,544 3,602 3,631 3,903 3,598 3,912 3,763
Provision for credit losses 190 261 280 421 442 486 823 751
Noninterest expense 2,719 2,140 2,176 2,070 2,340 2,158 2,002 2,113
Income from continuing operations before income
taxes and noncontrolling interests 640 1,143 1,146 1,140 1,121 954 1,087 899
Income taxes 147 309 234 308 301 179 306 251
Income from continuing operations before
noncontrolling interests 493 834 912 832 820 775 781 648
Income from discontinued operations, net of
income taxes (b) 328 22 23
Net income 493 834 912 832 820 1,103 803 671
Less: Net income (loss) attributable to
noncontrolling interests 17 4 (1) (5) (3) 2 (9) (5)
Preferred stock dividends 24 4 24 4 24 42593
Preferred stock discount accretion and
redemptions 11 131250
Net income attributable to common shareholders $ 451 $ 826 $ 888 $ 833 $ 798 $1,094 $ 786 $ 333
Per Common Share Data
Book value $61.52 $61.92 $60.02 $58.01 $56.29 $55.91 $52.77 $50.32
Basic earnings (c)
Continuing operations 0.86 1.57 1.69 1.59 1.52 1.45 1.45 0.62
Discontinued operations (b) 0.63 0.04 0.05
Net income 0.86 1.57 1.69 1.59 1.52 2.08 1.49 0.67
Diluted earnings (c)
Continuing operations 0.85 1.55 1.67 1.57 1.50 1.45 1.43 0.61
Discontinued operations (b) 0.62 0.04 0.05
Net income 0.85 1.55 1.67 1.57 1.50 2.07 1.47 0.66
(a) Noninterest income included private equity gains/(losses) and net gains on sales of securities in each quarter as follows:
2011 2010
in millions Fourth Third Second First Fourth Third Second First
Private equity gains/(losses) $ 4 $46 $42 $53 $40 $63 $75 $41
Net gains on sales of securities 62 68 82 37 68 121 147 90
(b) Includes results of operations for PNC Global Investment Servicing Inc. (GIS) and the related after-tax gain on sale. We sold GIS effective July 1, 2010, resulting in a pretax gain
$639 million, or $328 million after taxes, recognized during the third quarter 2010.
(c) The sum of the quarterly amounts for 2011 and 2010 does not equal the respective year’s amount because the quarterly calculations are based on a changing number of average shares.
206 The PNC Financial Services Group, Inc. – Form 10-K